ABSTRACT
We analyze an anonymous human genome contig using a variety of computational tools. We first download the sequence. Then, we analyze it by means of:- Downloading the sequence
- Alignment of transcripts (mRNAs/cDNAs/ESTs)
- Alignment of proteins
- Gene prediction
Web servers and databases:
- TIGR BLAST server
- est2genome
- spidey
- geneid
- ORF Finder
- Translate
- GFF format
- GFF2PS and gff2ps web server
- genewise
- procrustes
- GenomeScan
- NCBI site Blast
- EMBL RepeatMasker
1. Downloading the sequence
- Connection to the EMBL database:
EMBL database.
- Search the contig identified as AC091491
- Save the fasta sequence into a file on your folder: AC091491.fa
2. Alignment of transcripts (mRNAs)
2.1. Local alignments:
The alignment of genomic and transcript sequences is intended to show distribution of exons and introns along the genomic sequence. Thus, we compare the query sequence agains the database of human cDNAs (made of overlaping ESTs) using BLAST.- Access the TIGR BLAST server
- Paste the contig AC091491.fa
- Parameters: database: human, no query filter, default e-value, 100
descriptions and 100 alignments
- Save the results into a file in your folder:
AC091491.blast.cDNA
- Analize the best hit (NP105048) and the alignment to the contig:
- Do the same with the second (different) hit (THC1259113)
| Browse the BLAST result for these cDNAs and try to get and idea of the potential gene structure defined (make sure that you fully understand the output: Query and subject sequences, HSPs, strands, score and e-value). Note that the BLAST algorithm is based only on sequence similarity: thus, alignment ends are usually extended some extra positions. |
2.2. Alignments + splice junctions:
The alignment of genomic and mature transcripts is useful to pinpoint gene structures. It elicits the exon-intron regions in the genomic sequence and allow exon-intron junctions (GT donors and AG acceptors) to be checked. We use two diferent RNA-DNA alignment programs that take into account splice sites (est2genome and spidey).
est2genome:
- Access the
est2genome server
- Paste the cDNA (NP105048) and the genomic sequence (AC091491)
- Parameters: -space 2500000, -align (see the final alignment)
- You will receive the results by e-mail in the address you choose
- Save the results into a file in your folder:
NP105048.AC091491.est2genome
- Repeat the same process for the second hit: THC1259113.AC091491.est2genome
spidey:
- Access the Spidey server
- Paste the cDNA (NP105048) and the genomic sequence (AC091491)
- Parameters: default parameters
- Save the results into your folder:
NP105048.AC091491.spidey
- Repeat the process for the second hit: THC1259113.AC091491.spidey
| Have a careful look at these gene structures, searching the putative splice junctions. Take into account that this is the exonic structure of both genes including the Untranslated Region (UTR). |
Distinguish coding exons from non-coding ones:
- Access the geneid server
- Paste the cDNA sequence (NP105048)
- Select human and geneid output
- Save the prediction into your folder: NP105048.geneid
- Run the program for the other cDNA and save the result: THC1259113.geneid
| The Start codon (ATG) in the cDNA NP105048 can not be found because there is not room to compute any profile for that signal at the very beginning of the sequence. In the second sequence it seems that a correct open reading frame is predicted. |
Obtaining the Open Reading Frame for NP105048:
- Access the server ORF Finder
- Paste the cDNA and submit the form to obtain all possible ORFs
- Check the results: ORF plot
- Select the longest ORF (usually the real one) to see in which strand and in which frame you get the longest ORF.
Translate both putative ORFs into proteins:
- Access the server Translate
- Translate both cDNAs into the proteins: NP105048
and THC1259113
- Finally, compare our predictions to the protein annotation for these cDNAs: for NP105048 and for THC1259113
Apparently, coding regions span from nt:
|
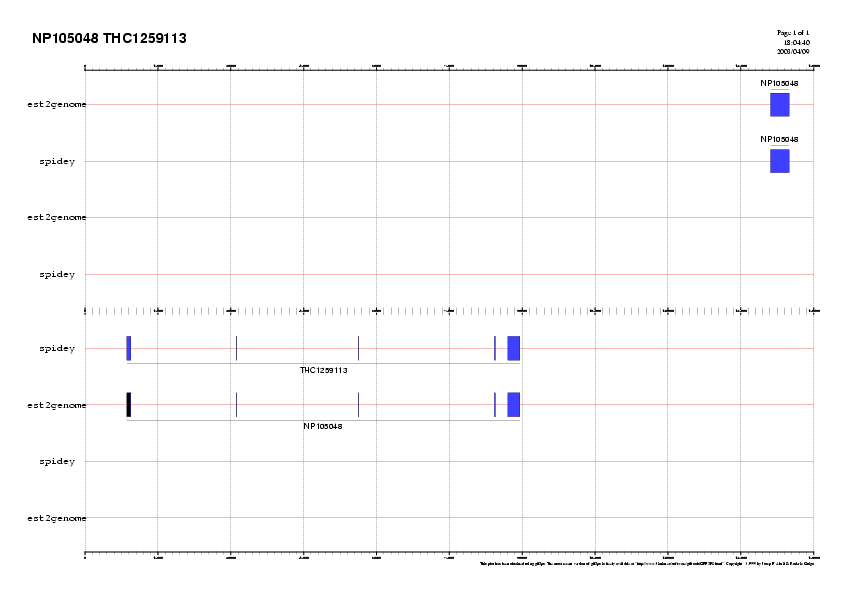
Graphical representation
- The command line GFF2PS program
will be used to produce the plots
- Input: GFF format files containing the exonic structures:

UTRs appearing in black
3. Alignment of proteins
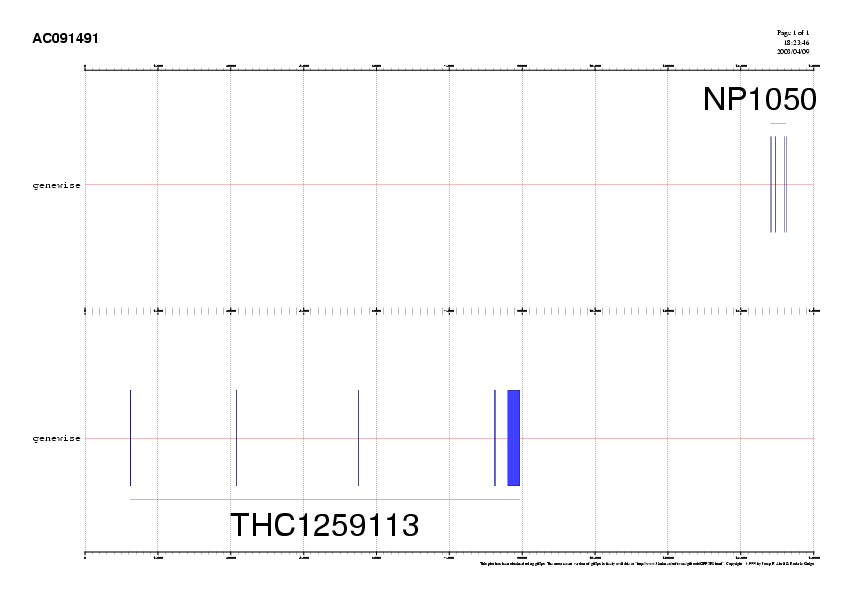
Potential gene structures in genomic sequences can be defined through the alignment of protein sequences as well. In this case, both proteins are the result of translating their respective cDNAs but an alternative option would be blasting our genomic sequence against a set of known proteins, which is usually the case in the lab. Two diferent protein-DNA alignment programs that take into account splice sites may be used: genewise and procrustes.- Access the genewise server
- Paste the protein NP105048 and the contig AC091491.fa
- Parameters:
- Check the gene prediction in
NP105048.prot.AC091491.genewise
- Repeat the process with the second one and check the result: THC1259113.prot.AC091491.genewise
| Due to the blast output, we know that the THC1259113 protein is coded in reverse strand on the genomic sequence. Be aware that, if needed, we could have used more distant protein homologs to build up the gene. However, we would have lost some accuracy. |

4. Gene prediction
Homology information can be also used to annotate genomic sequences. GenomeScan is a program to identify exon-intron structures of genes in genomic DNA sequences from a variety of organisms, with a focus on human and other vertebrates. The algorithm combines two principal sources of information:- Models of exon-intron and splice signal composition.
- Sequence similarity information such as BLASTX hits.
4.1. Obtain the similarity information (BLAST alignments)
First, we use the protein we built up to search for homologs. This time, we want to use rather distant proteins, instead of the the corresponding human one. In this way, we can check the program performance when using lower sequence similarity information.
- Access the NCBI site Blast
and align these 2 proteins to the Swiss-Prot database (blastp)
- Parameters: select rodents and use an e-value of 0.00001
-
Check BLAST results: NP105048.prot.sw.homologs.blast
and THC1259113.prot.sw.homologs.blast.
-
Save the results into the respectives fasta files:
for NP105048 and
for THC1259113.
And get them together in: for NP105048 and THC1259113
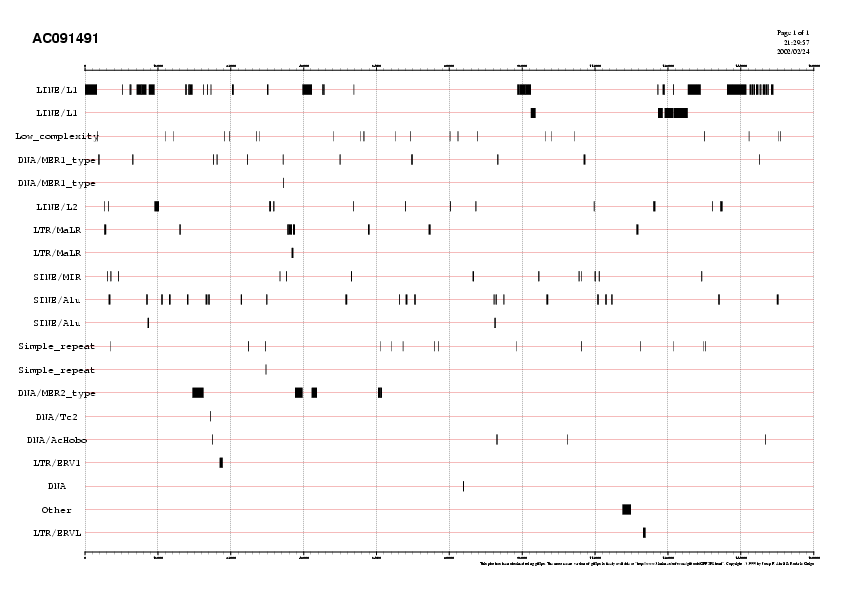
4.2. Filter the repeats along the contig
However, before running GenomeScan we will first mask the sequence in order to increase sensitivity (Sn) and specificity (Sp). A large fraction of genomic DNA belongs to relative small number of repeat families. A popular program to identify repeats in DNA sequences is the RepeatMasker.RepeatMasker analysis produces a number of files. Among them:
By taking a look at this last file, we see that close to 40% of our sequence belong to repetitive DNA.

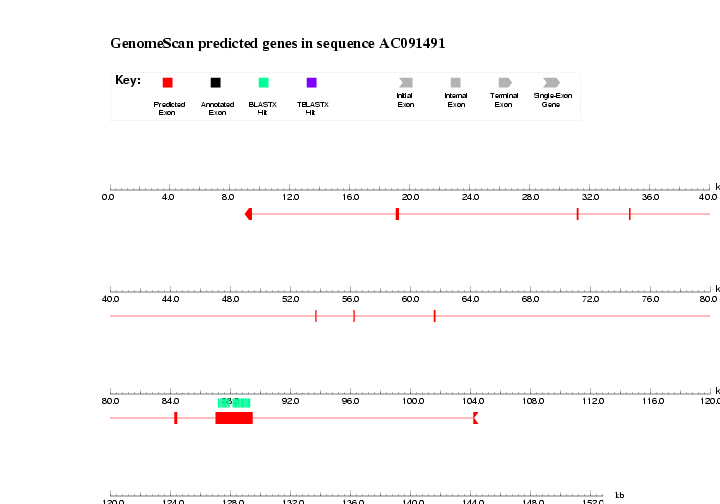
4.3. Run GenomeScan with this information (homologous proteins masked sequence)
- Connect to the a GenomeScan webserver
- Parameters: Select the option: Predicted CDS and peptides.
- Save results and check them: AC091491.masked.genomescan

| Do we get predictions for both genes? Is all similarity data used? If not, probably part of the contig where the gene was, has been masked by RepeatMasker. |