| |
Summary
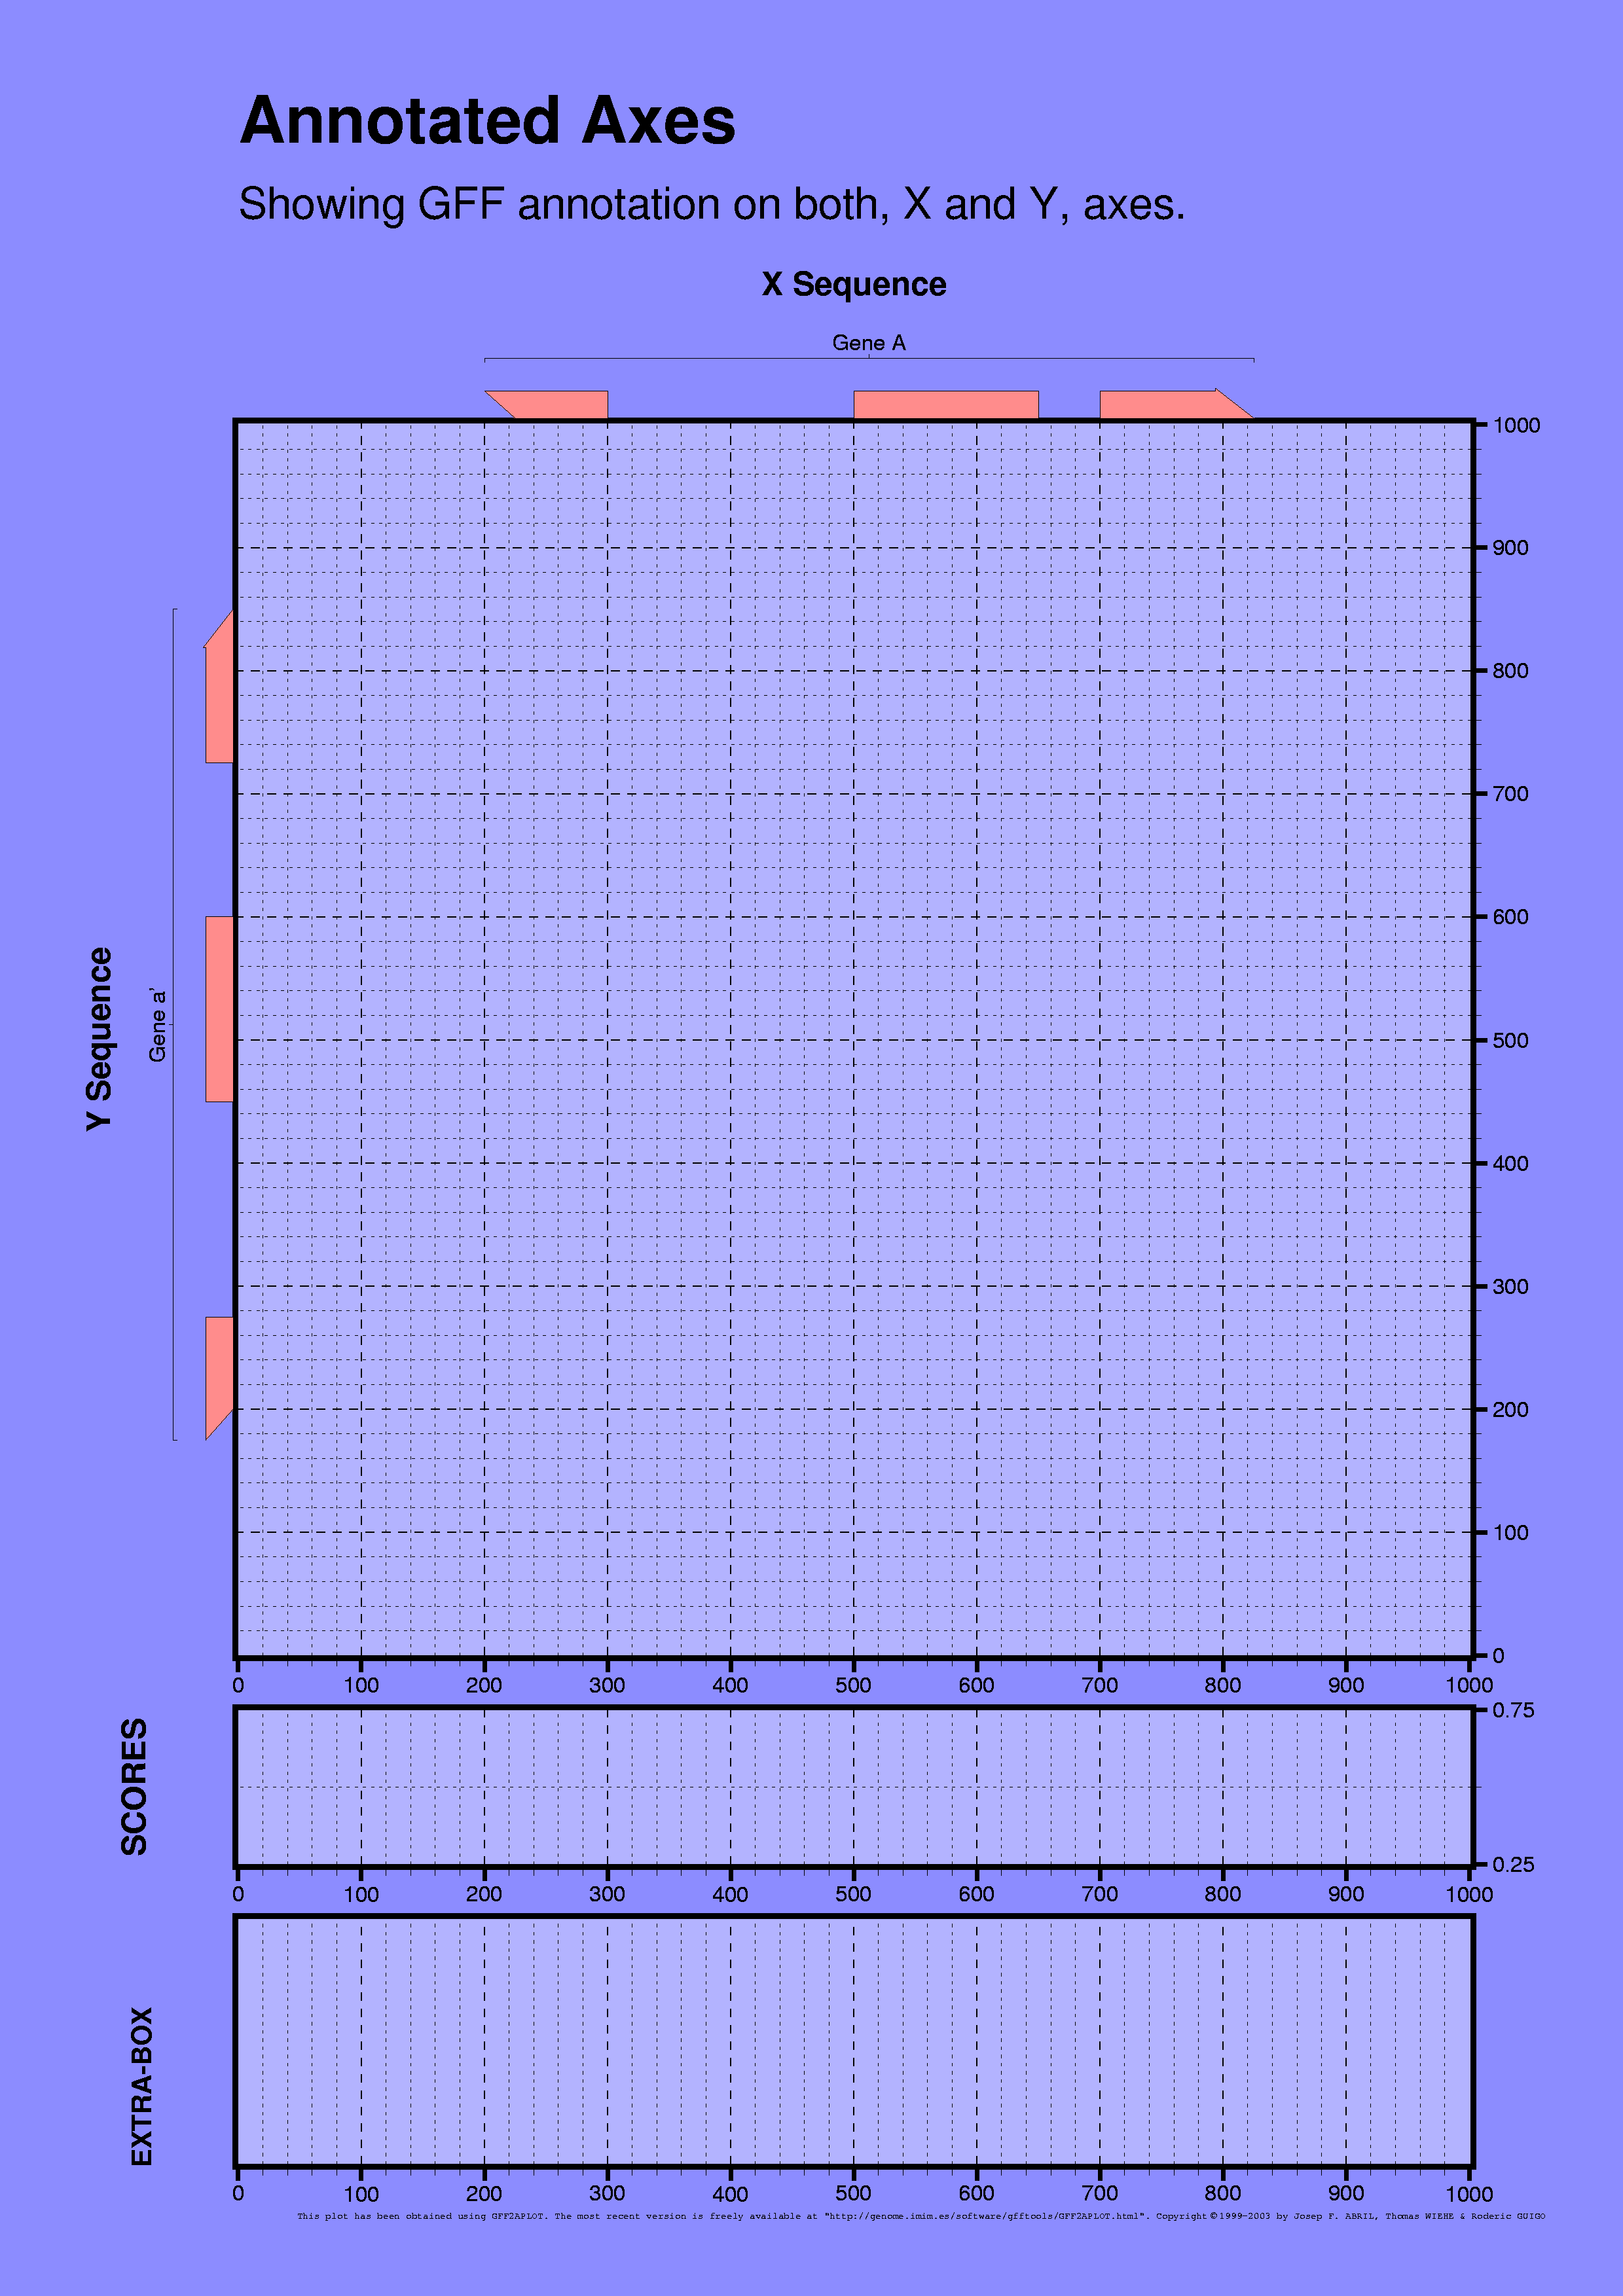
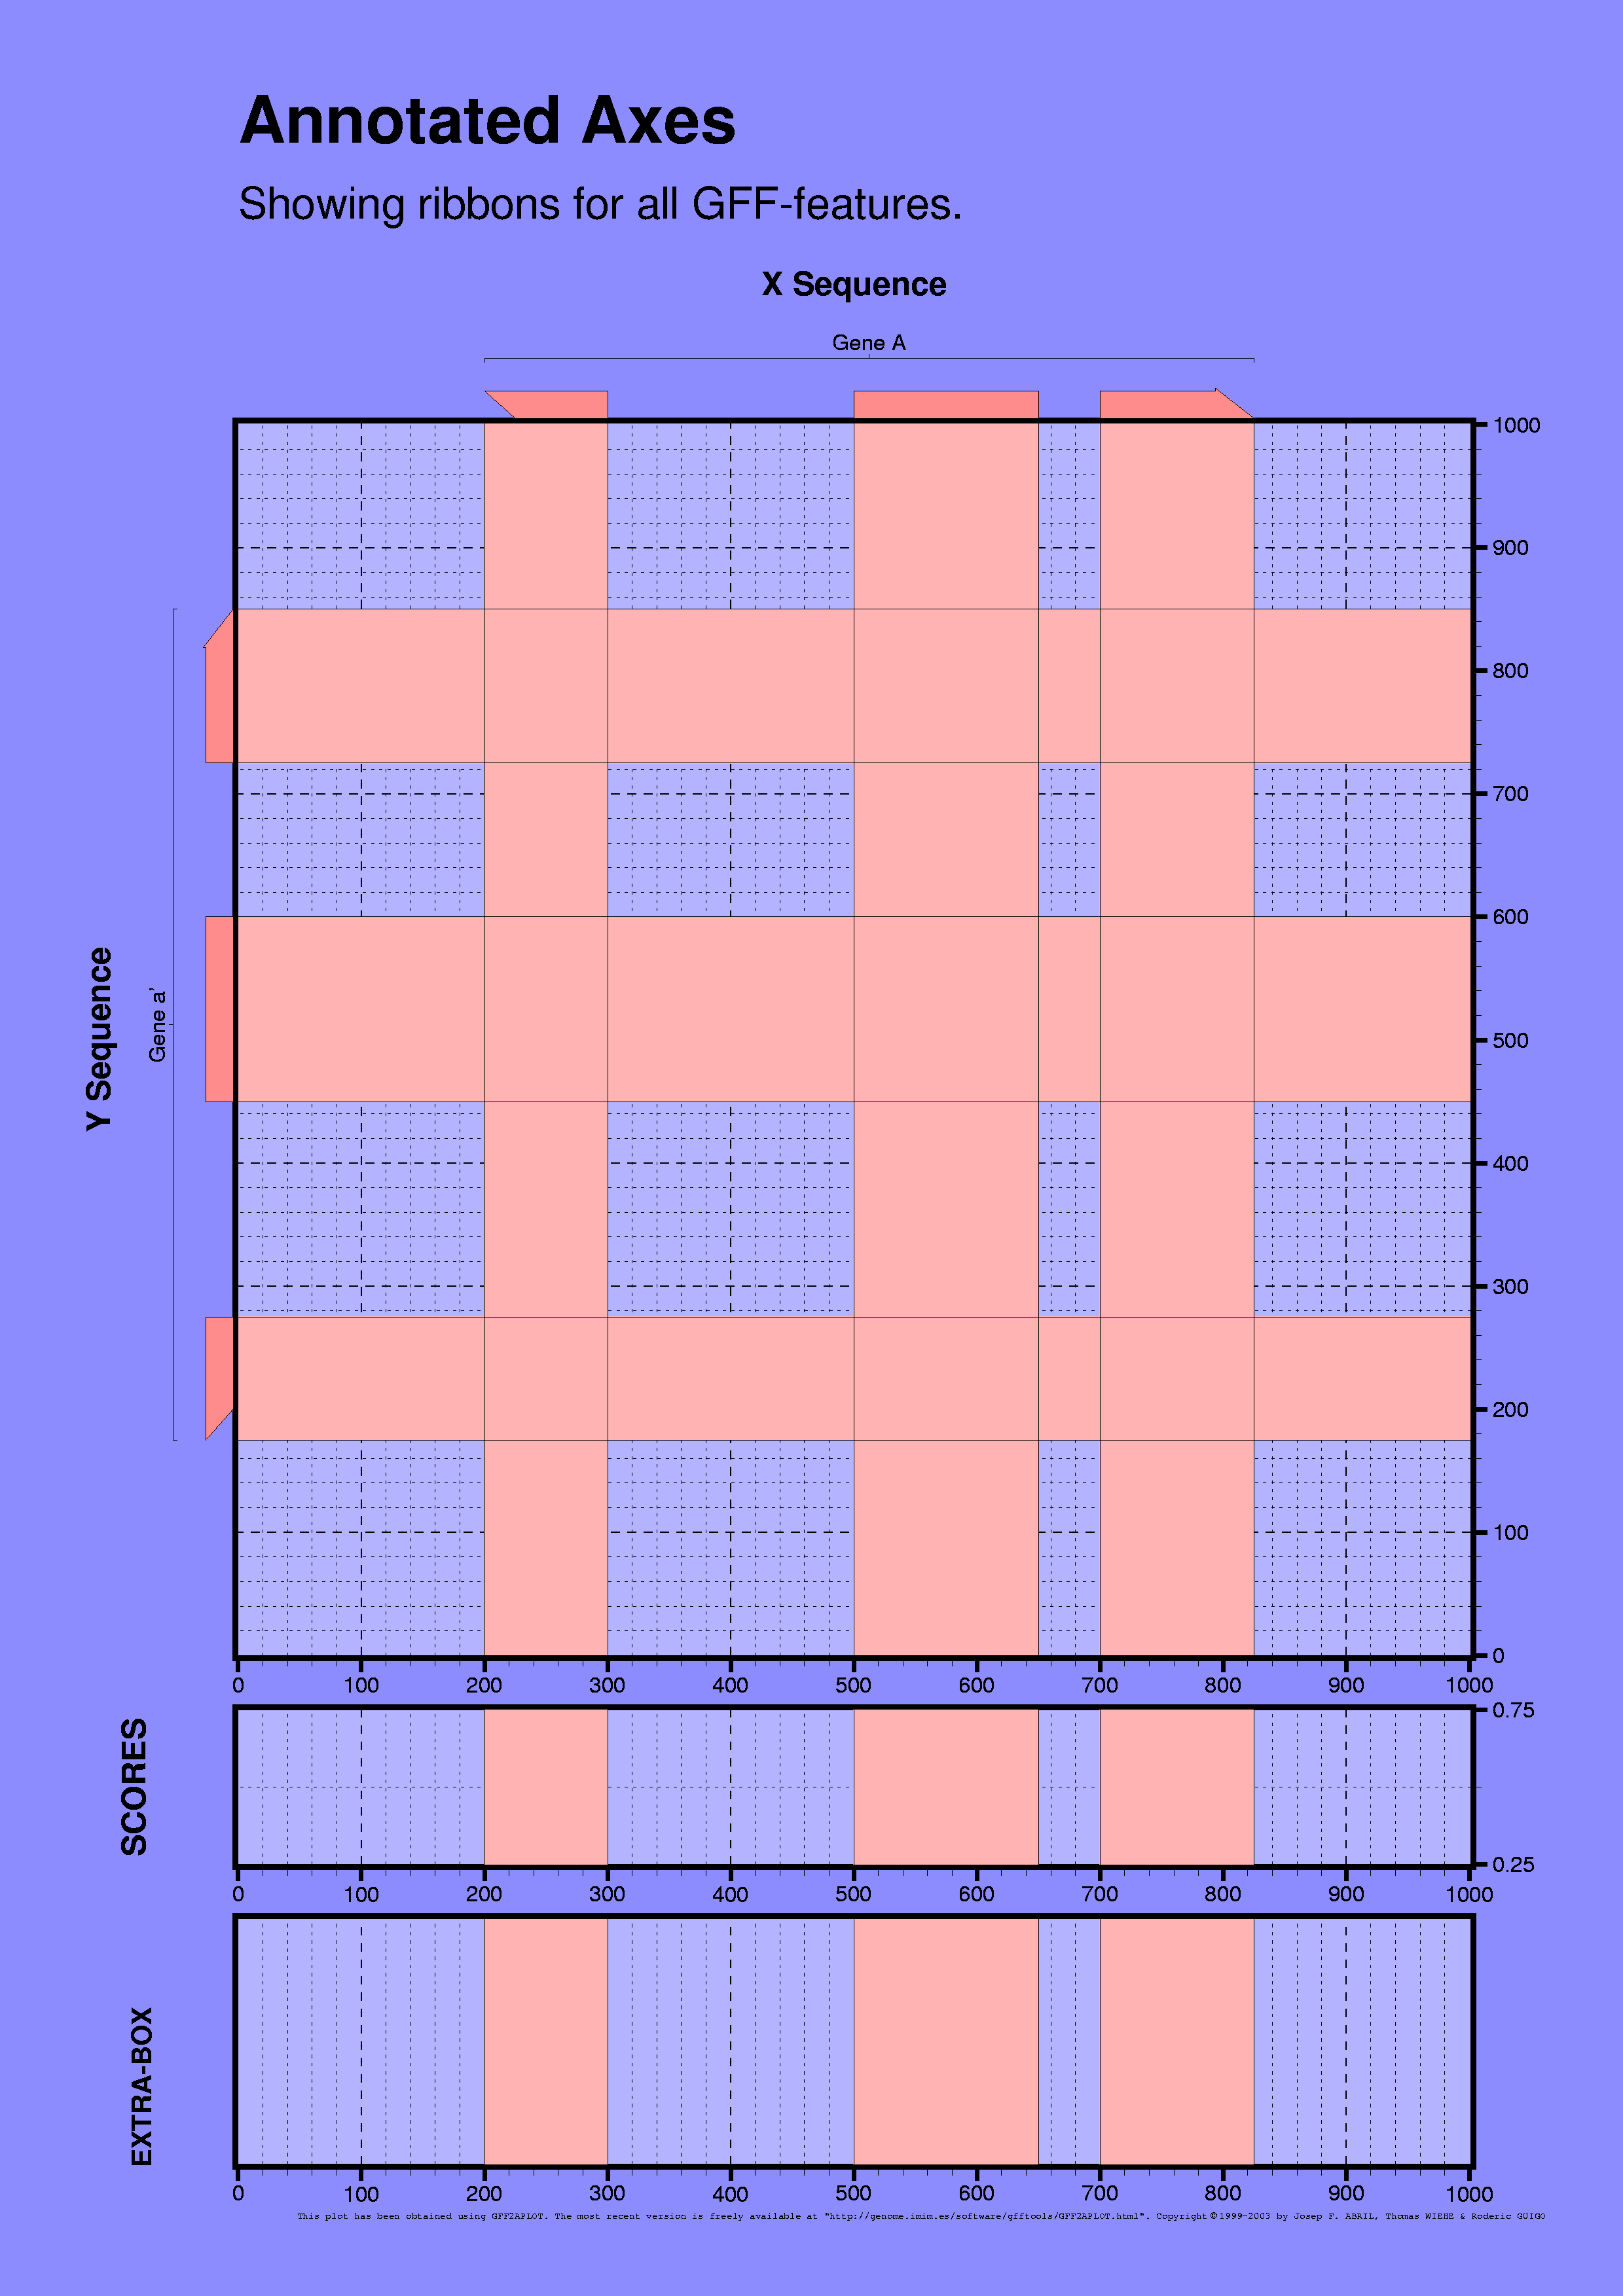
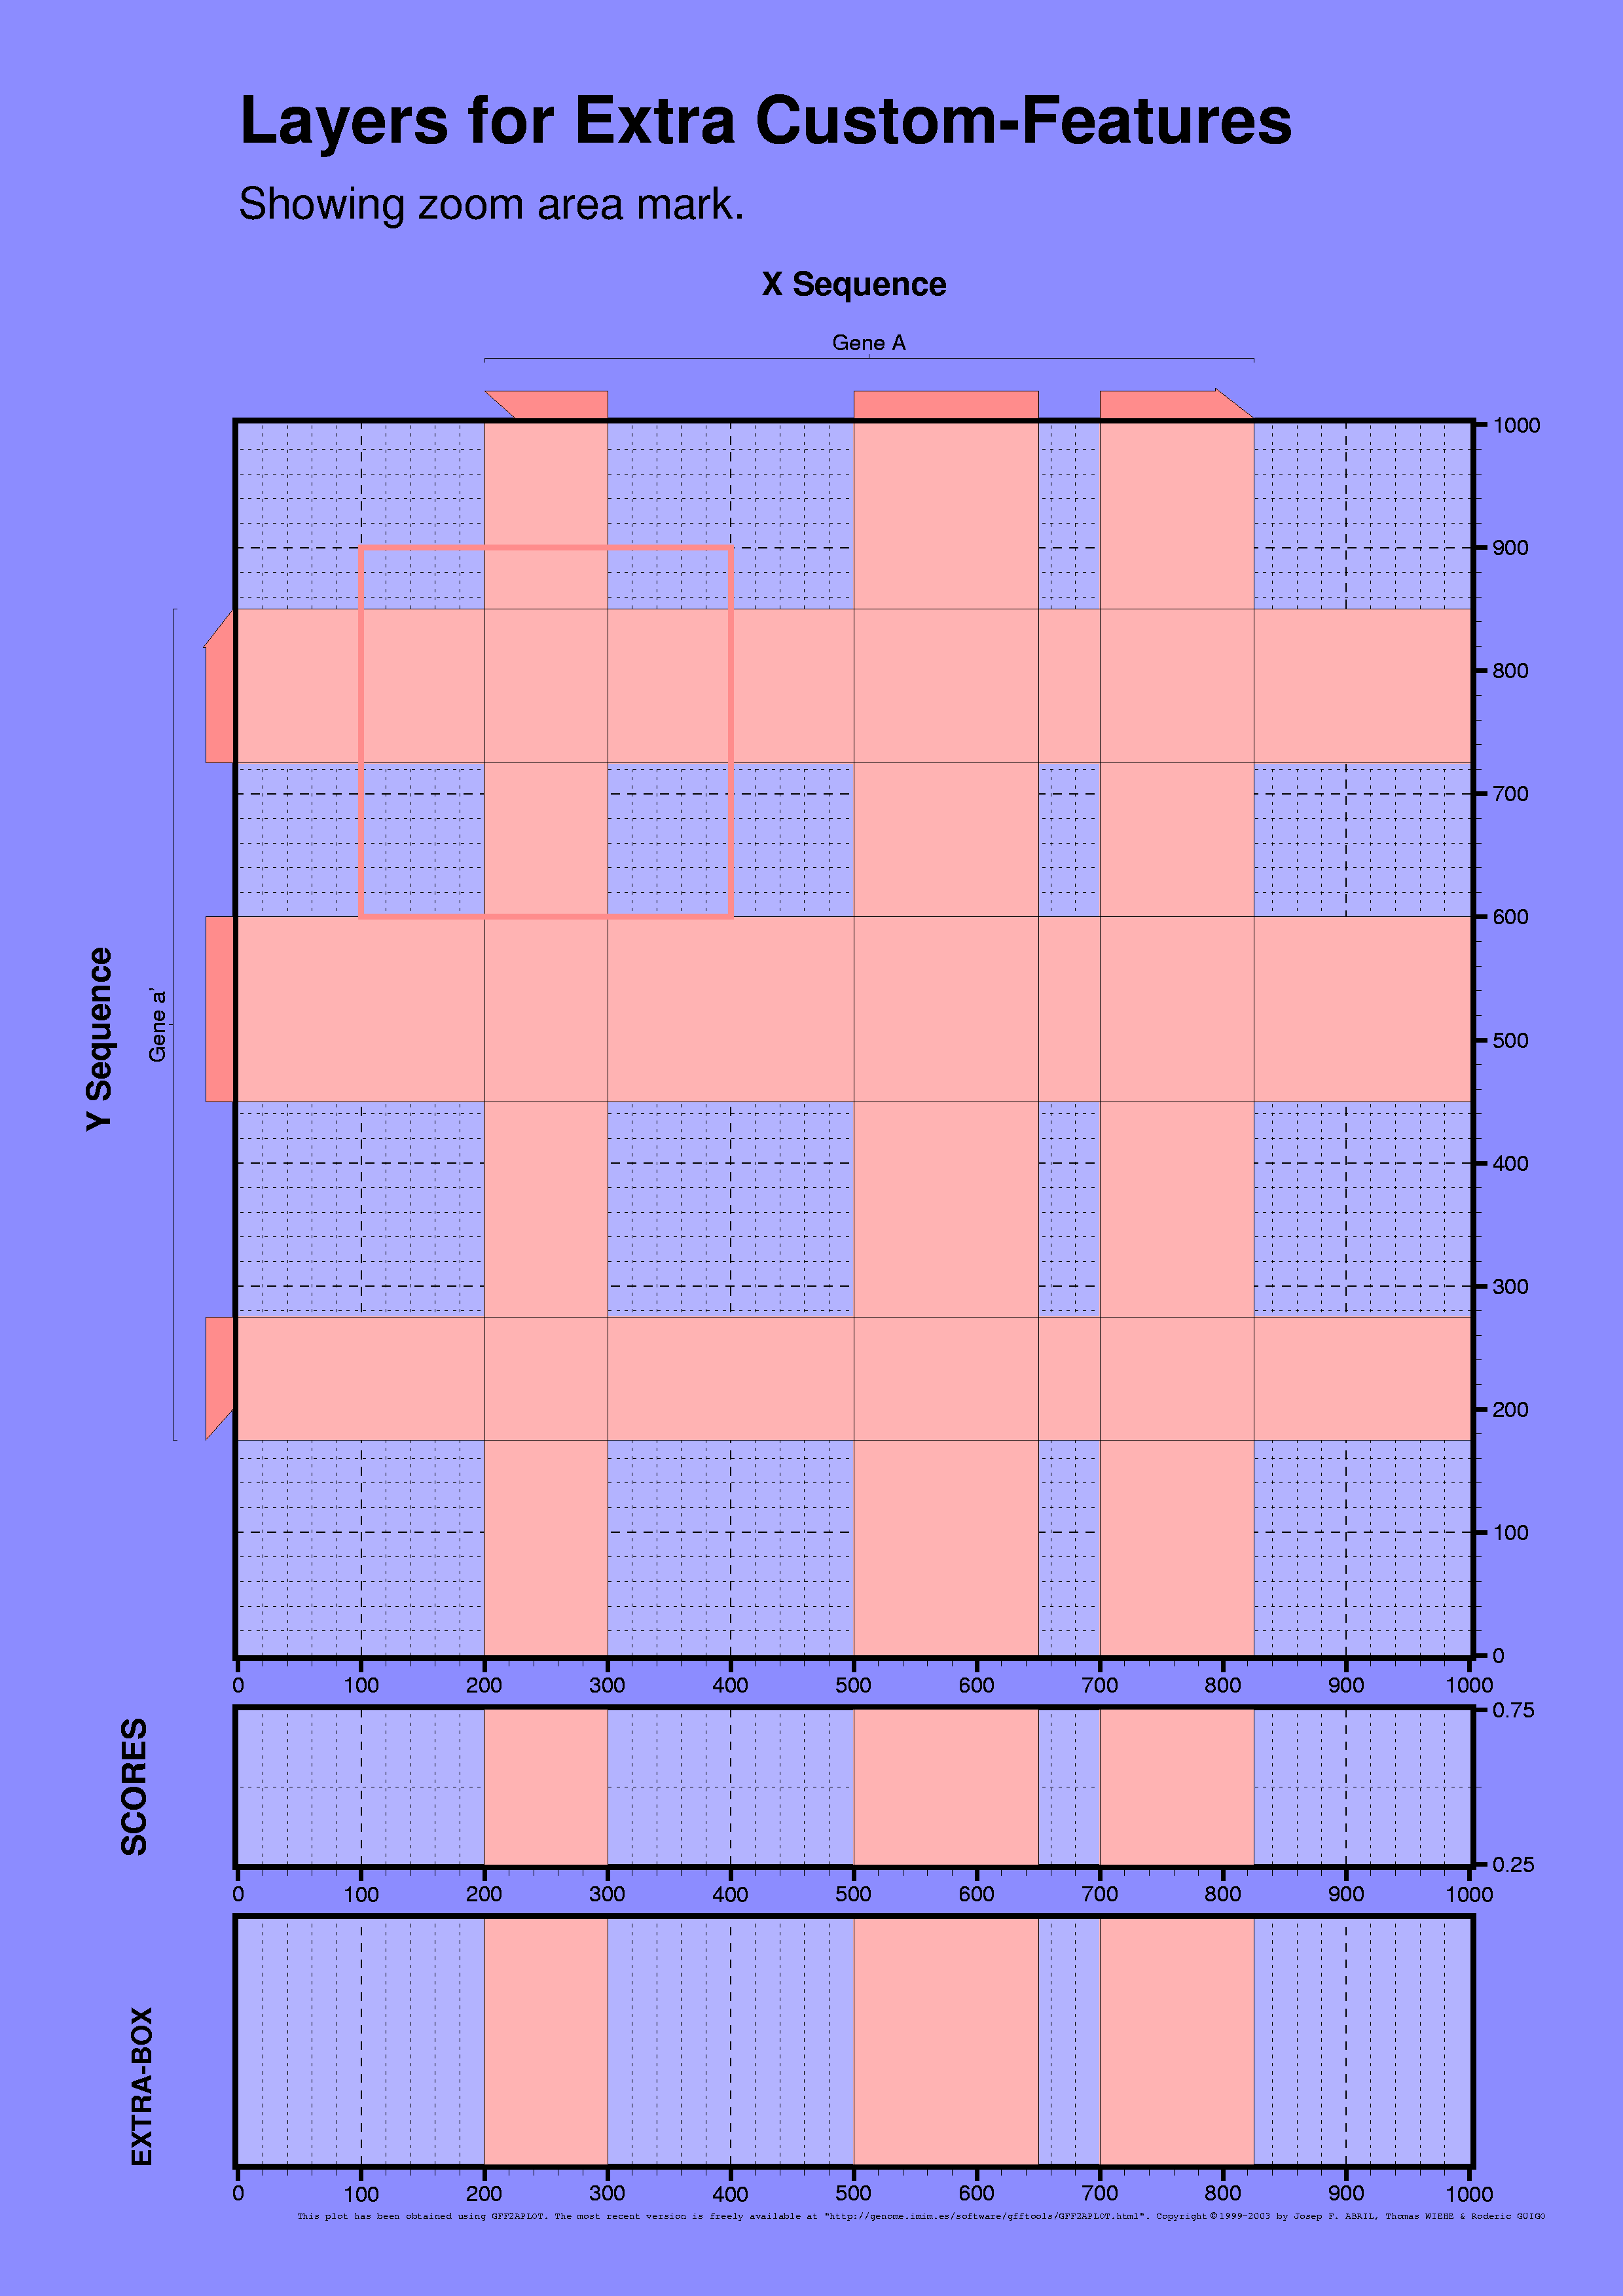
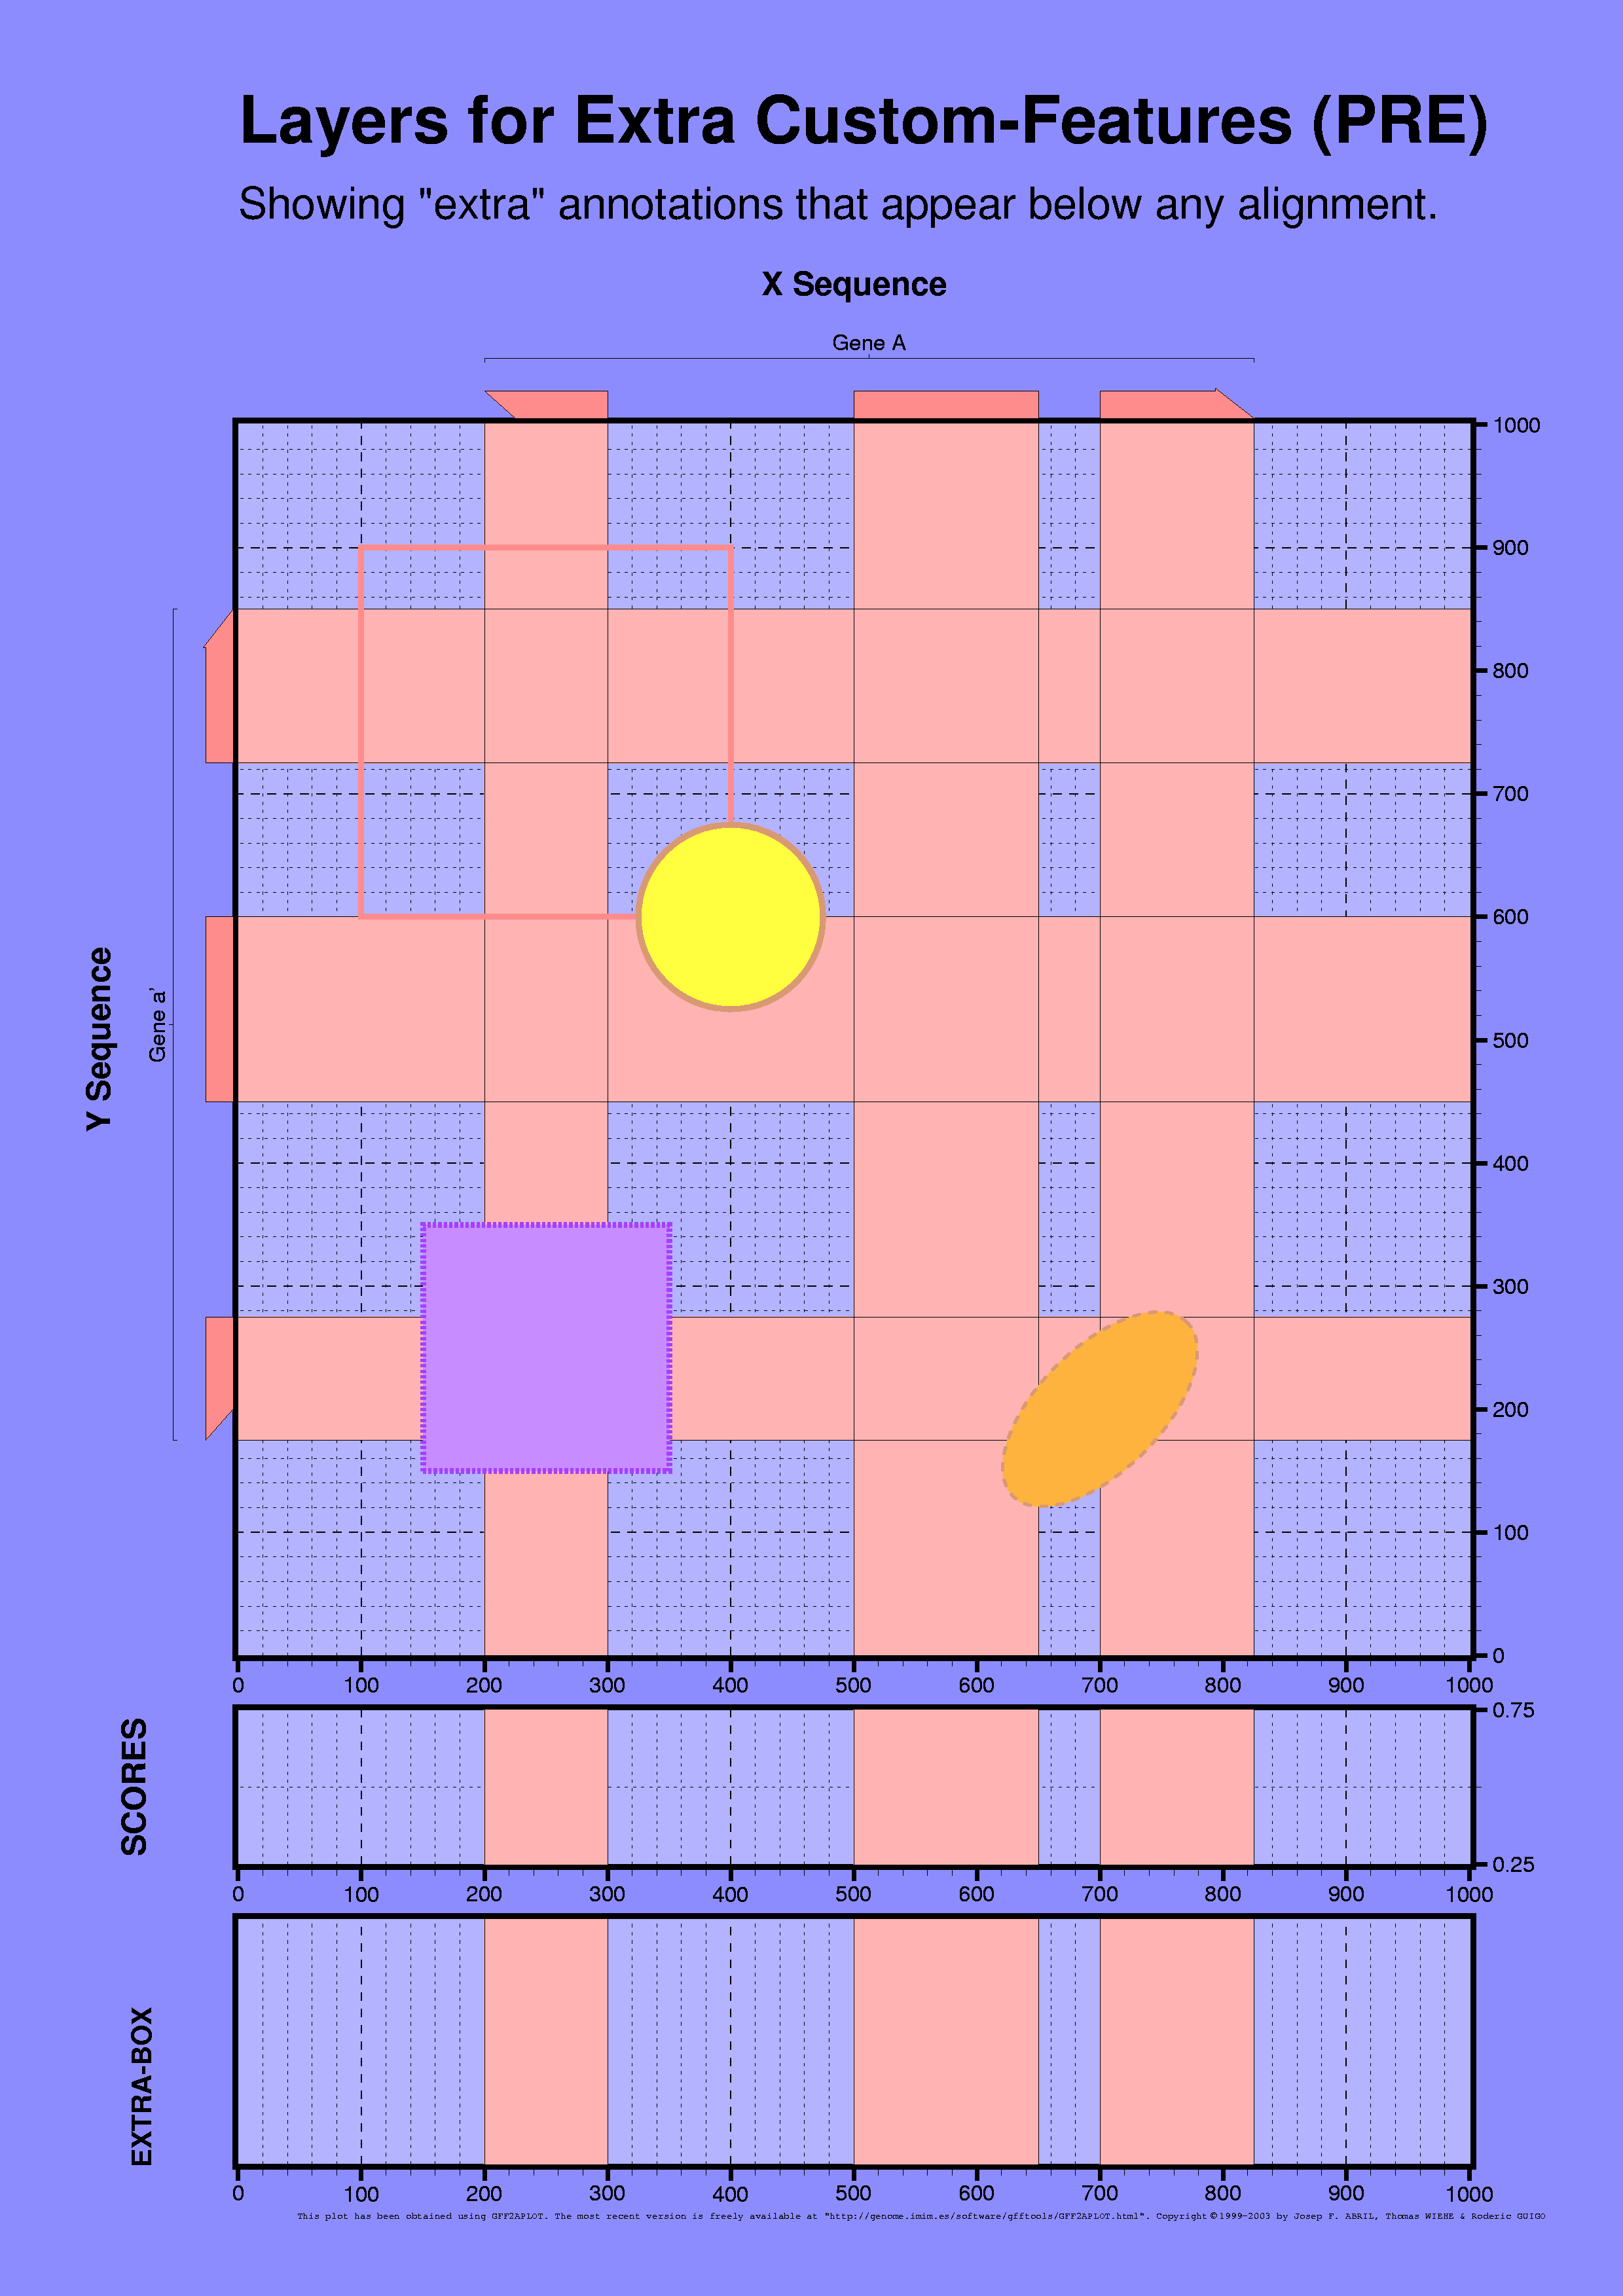
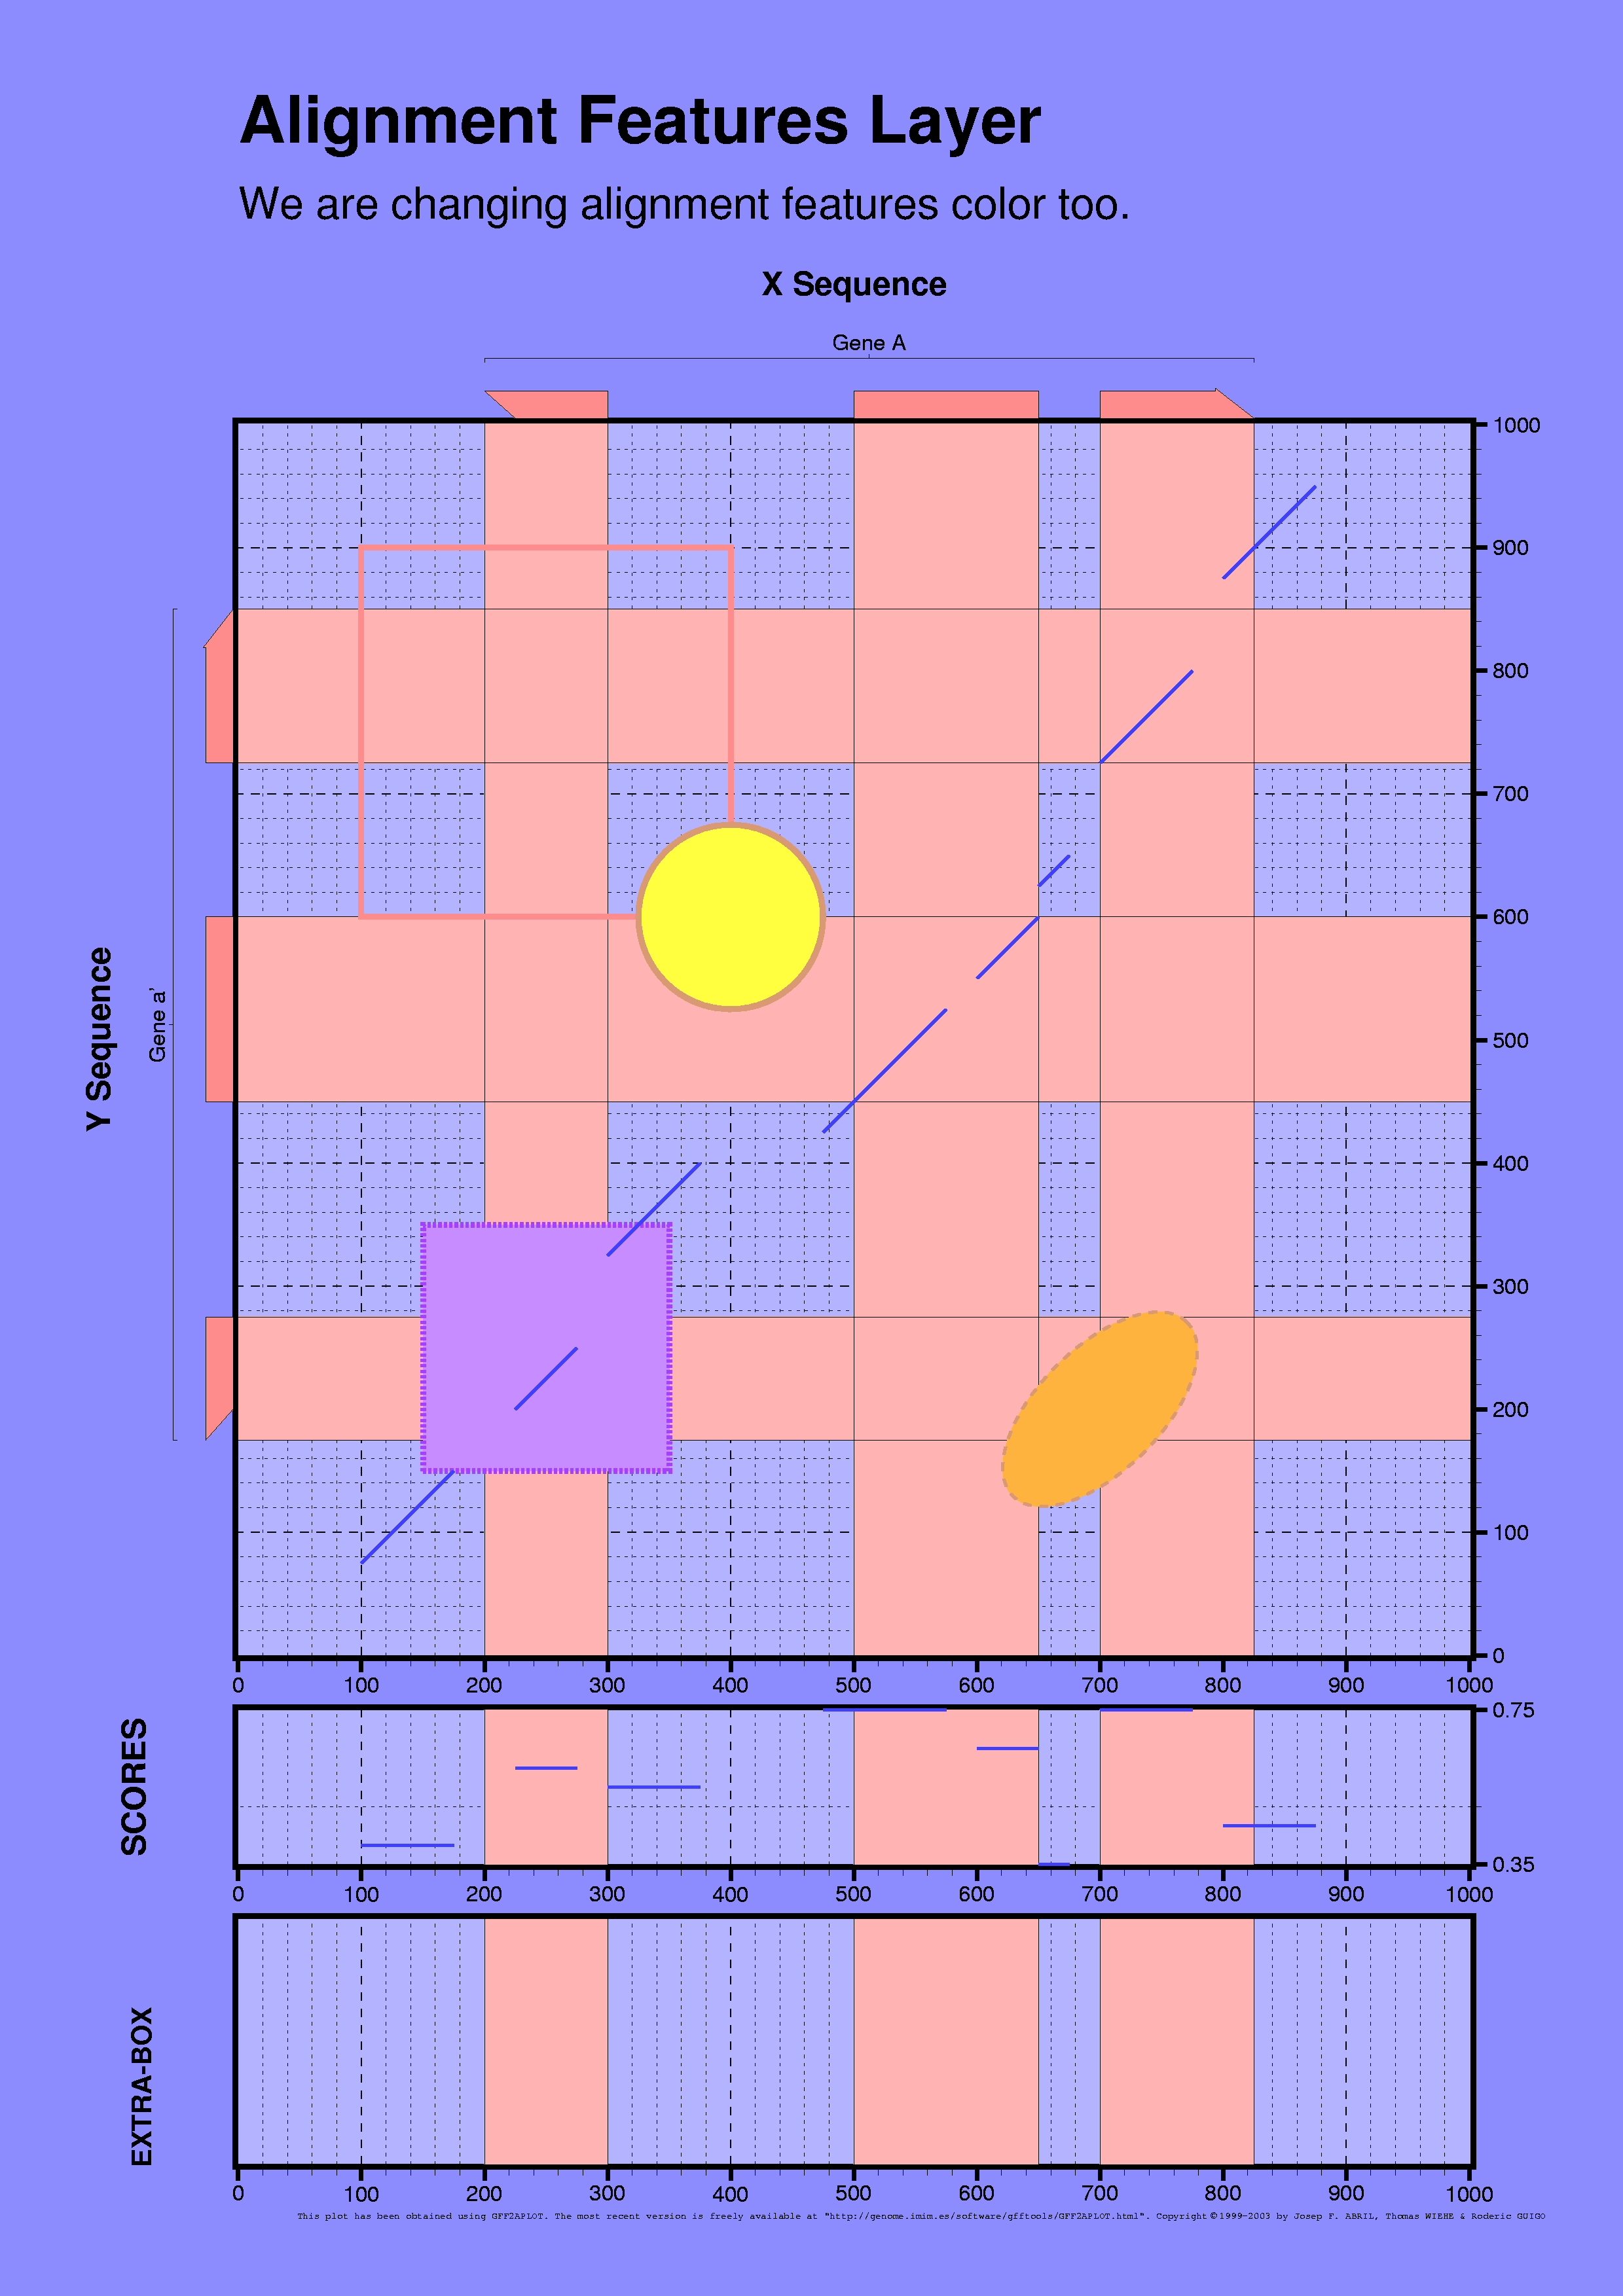
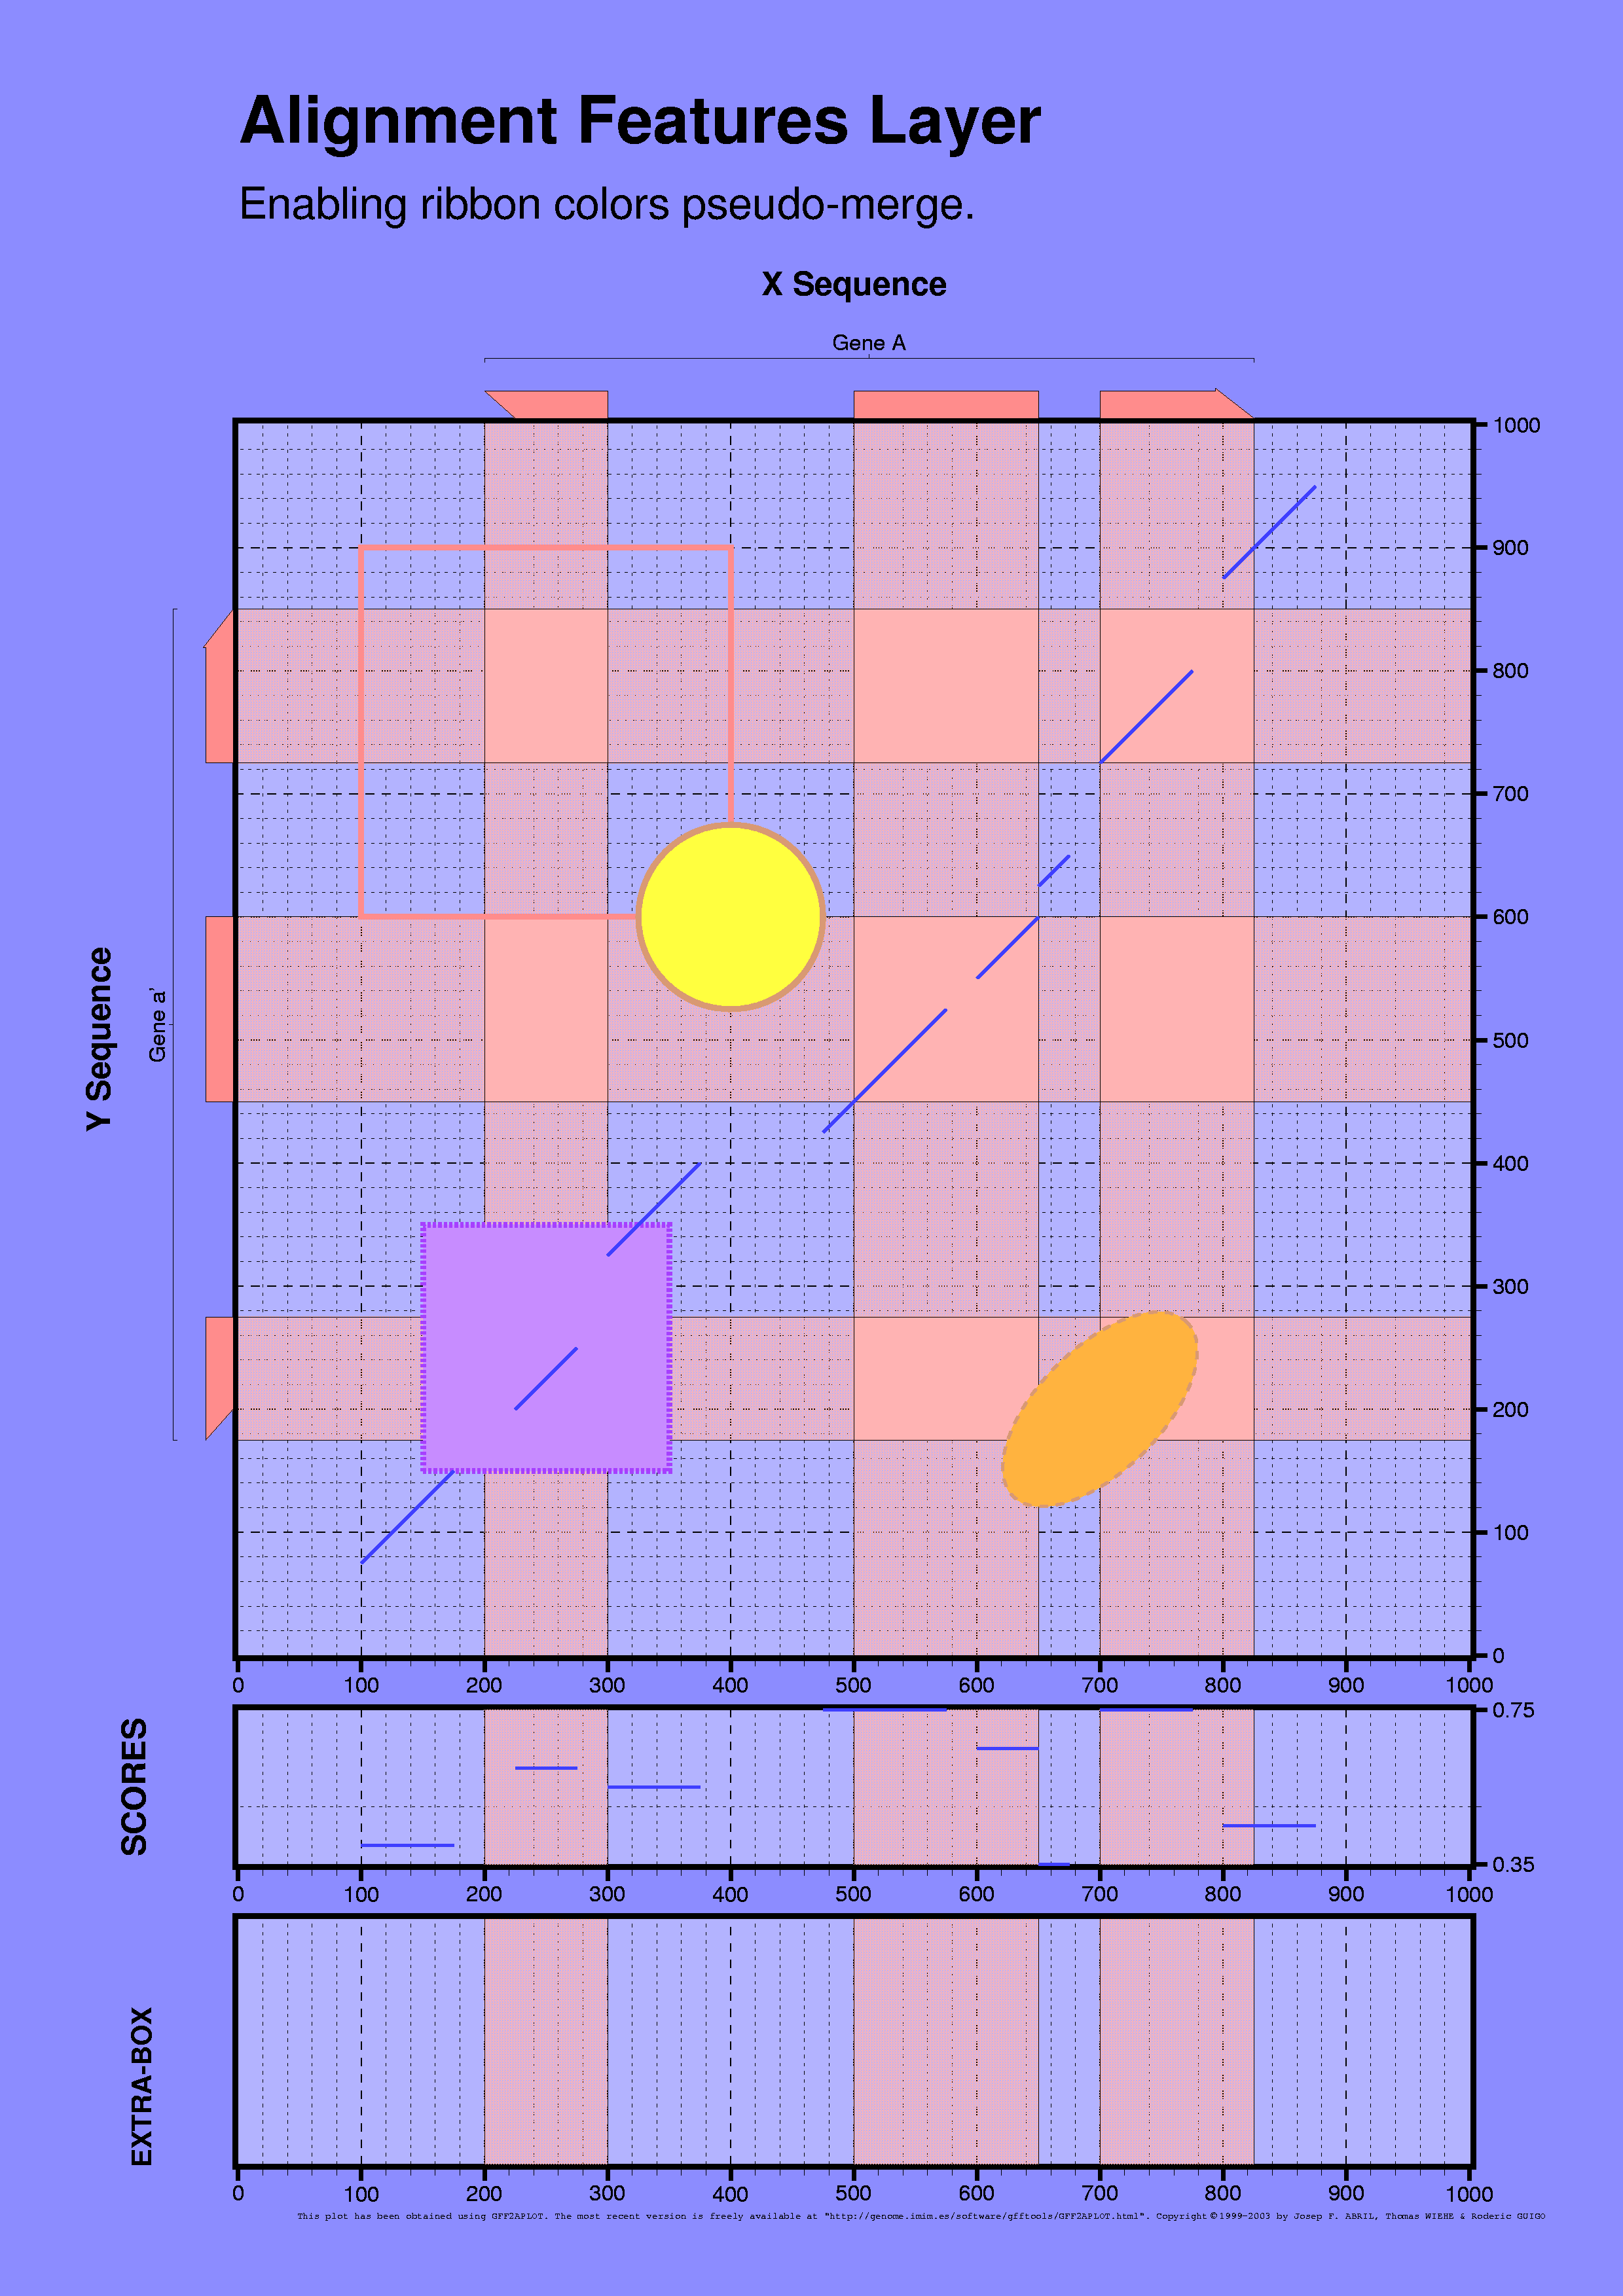
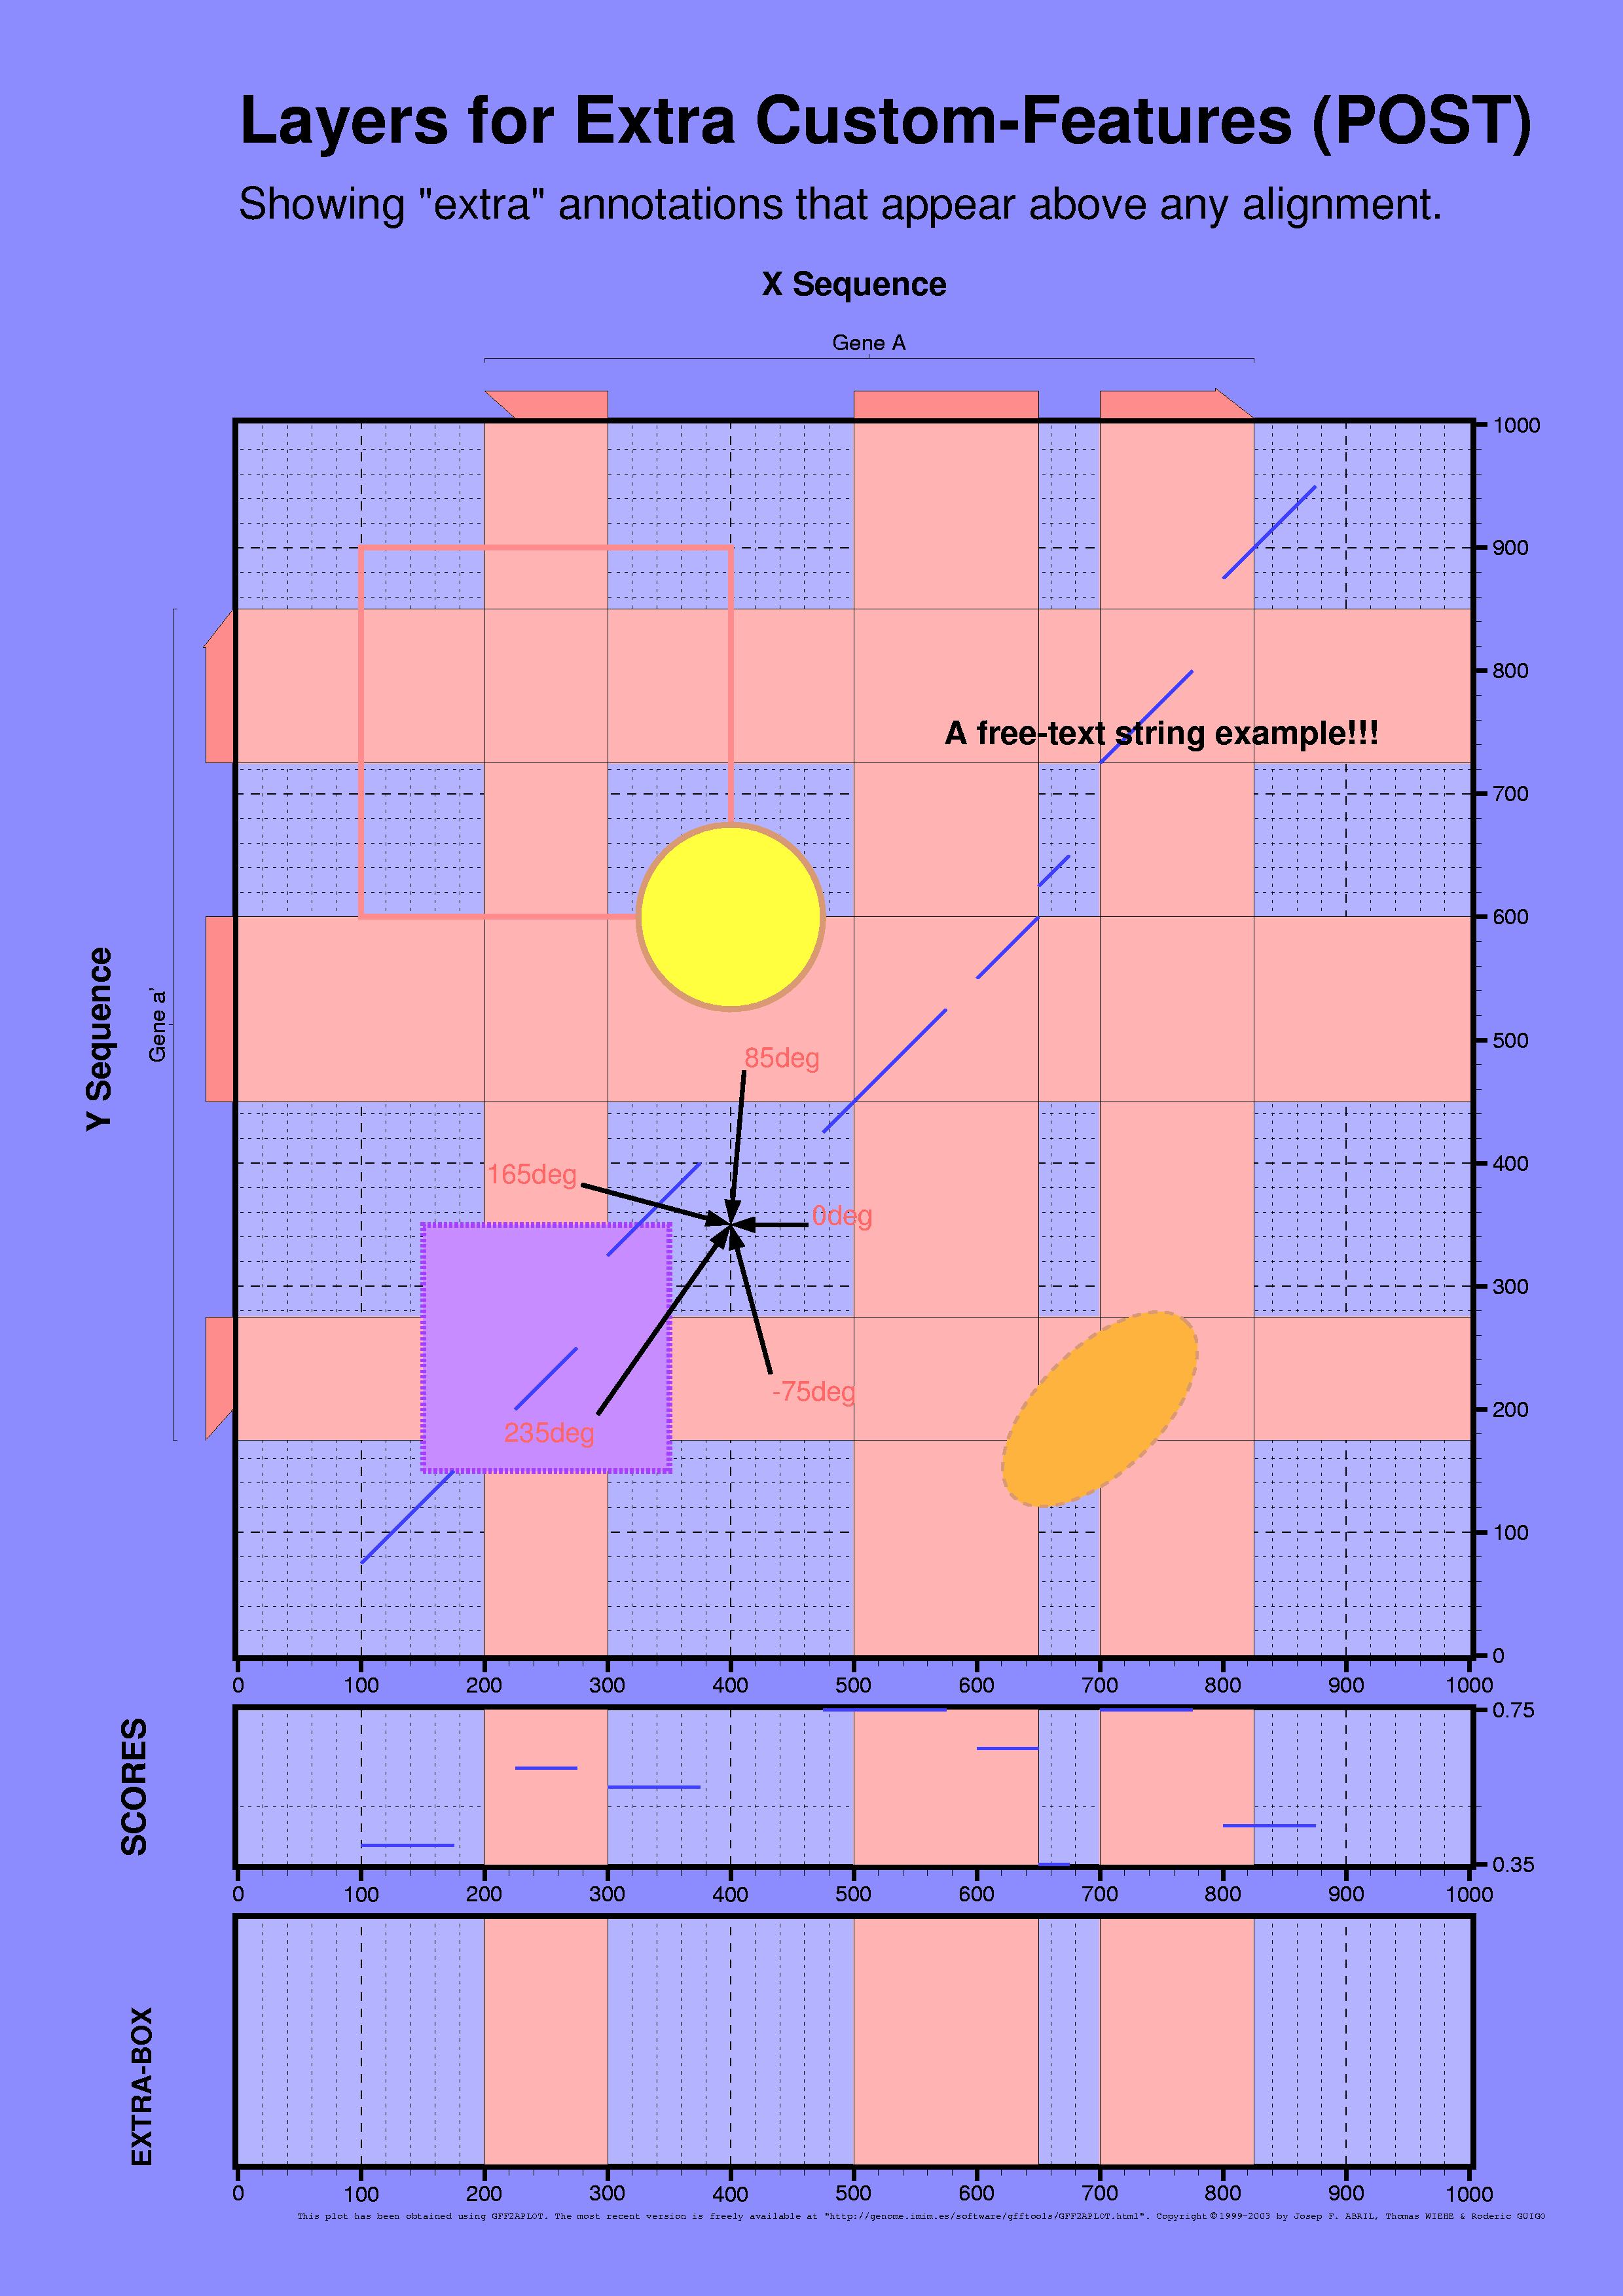
PostScript language does not allow transparencies. Therefore, the order in which figure elements are printed on the final plot is crucial. Each set of features drawn by gff2aplot is put into one of the pre-defined layers. It is obvious that it is important to know which layers we have and what can be shown on each of them.
Another interesting feature that we can learn here is the way gff2aplot can handle customizing parameters. All the available variables are at the beginning set from program's internal defaults. Command-line options always override previous customization values. But the most important feature is the programn's ability to sum that to any parameters from whatsoever customization files we will provide.
NOTE.- For the sake of clarity, we are going to use long names for the comand-line switches. See the command-line help if you prefer short names for those cases in which a short name is available.
Bitmaps for the examples were generated as PNGs (Portable Network Graphics). If your browser is not ready for such format yet, you can visualize the PDF or PS versions by clicking on the links below each snapshot. Links to customization files, log files, GFF input files and output PostScript figures, are also available on each command-line shown.
Contents
|
Bottom Layer
|

|
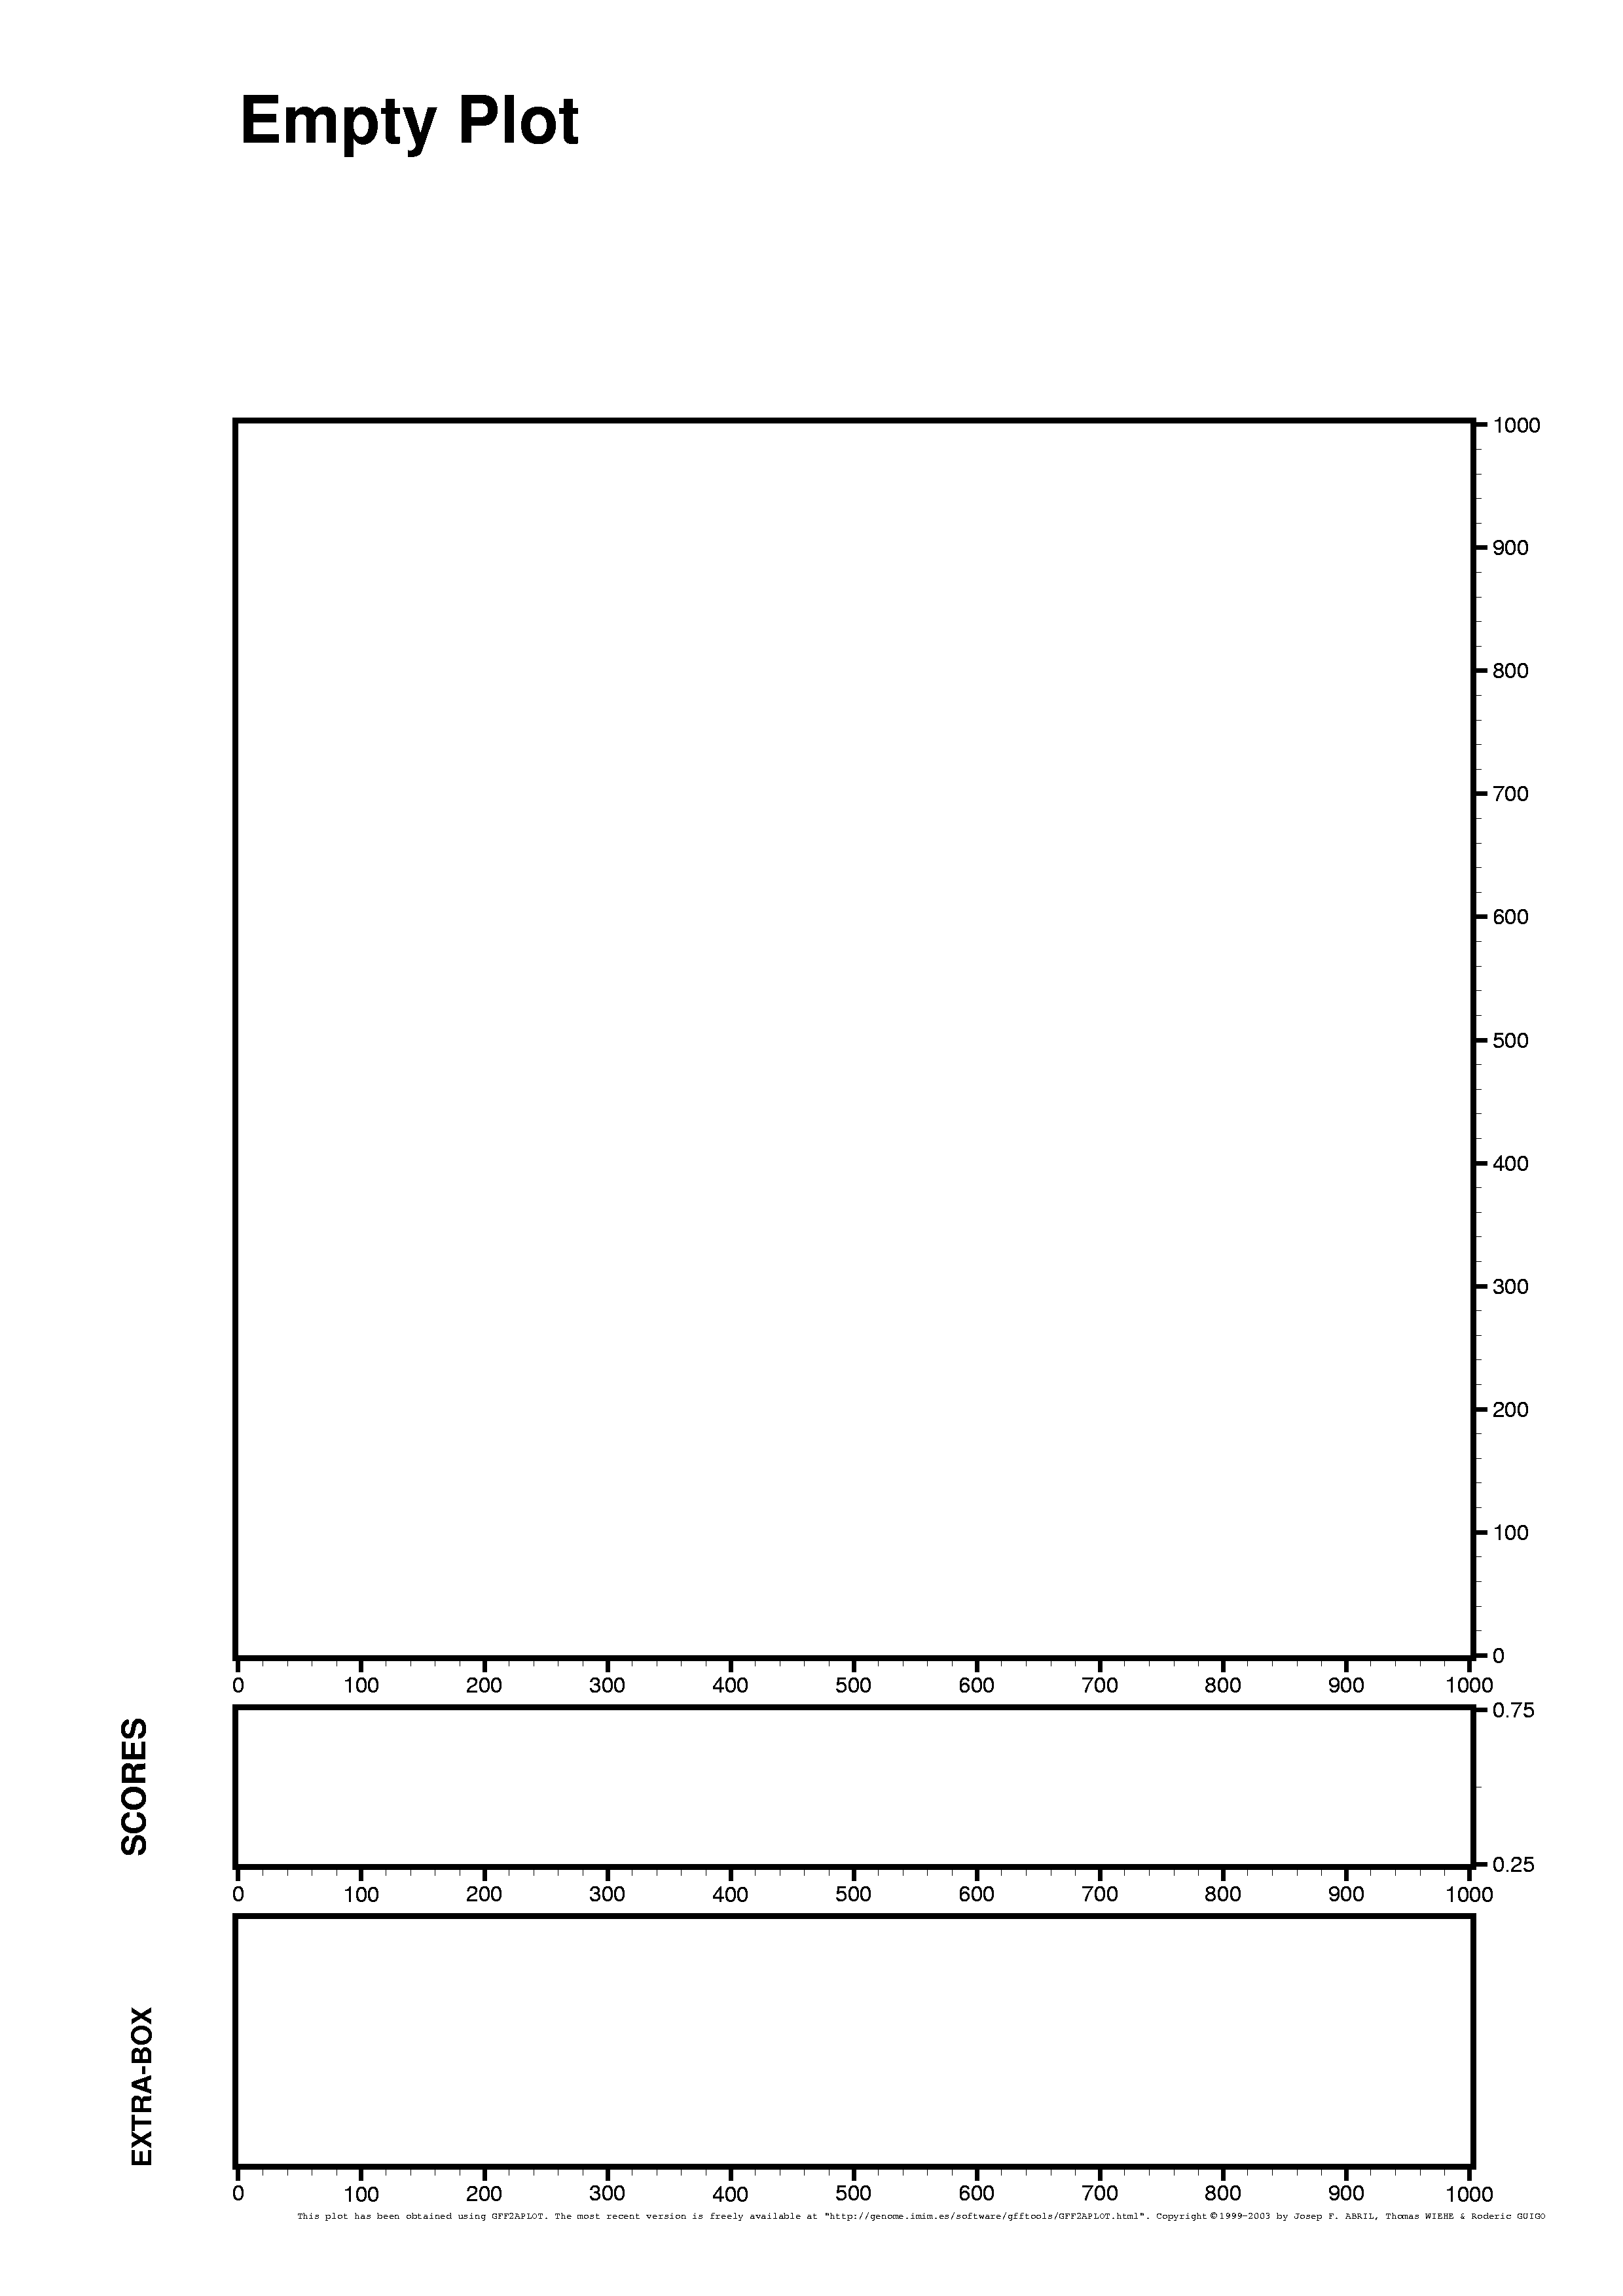
[PNG] [PS] [PDF]
| |
gff2aplot.pl                           \
    --logs-filename plot_layers_bg.log \
    --show-percent-box                 \
    --show-extra-box                   \
    --x-sequence-coords 0..1000        \
    --y-sequence-coords 0..1000        \
    --title 'Empty Plot'               \
    --percent-box-label 'SCORES'       \
    --extra-box-label 'EXTRA-BOX'      \
    --x-label ''  --y-label ''         \
    -- plot_layers_nodata.gff          \
     > plot_layers_bg.ps
| |
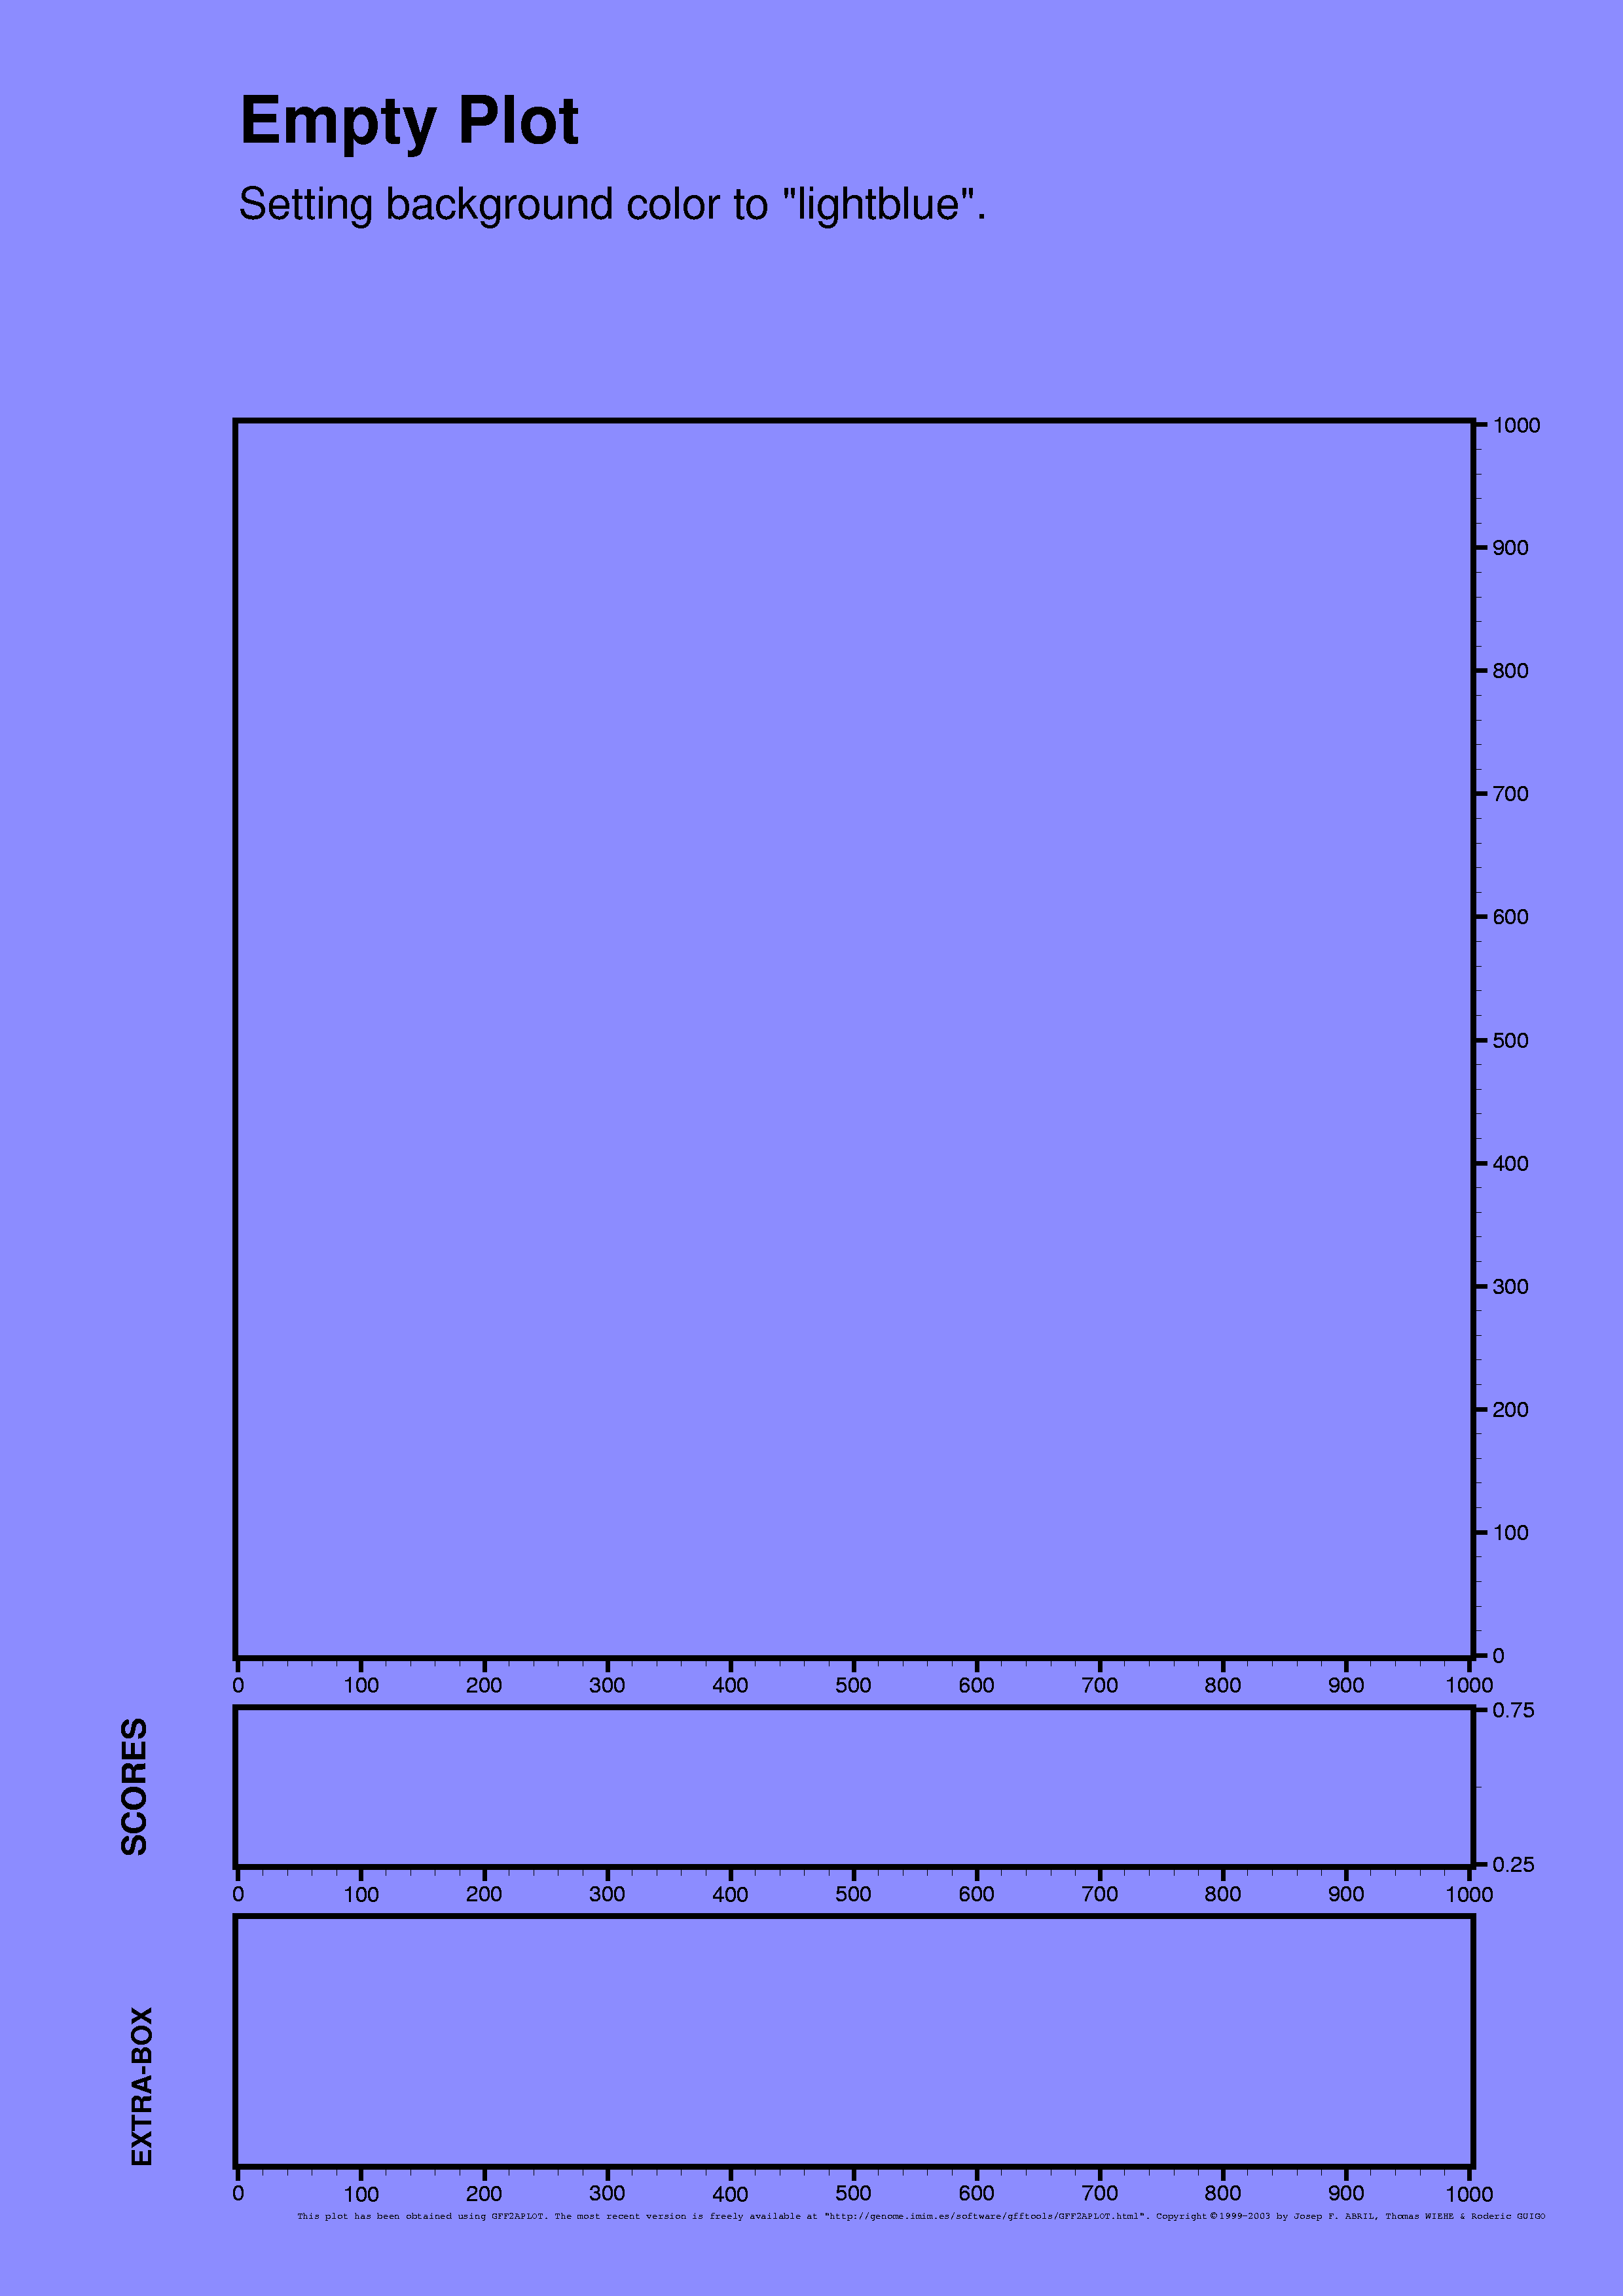
[PNG] [PS] [PDF]
| |
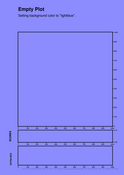
gff2aplot.pl                                     \
    --logs-filename plot_layers_bgcol.log        \
    --show-percent-box                           \
    --show-extra-box                             \
    --x-sequence-coords 0..1000                  \
    --y-sequence-coords 0..1000                  \
    --title 'Empty Plot'                         \
    --subtitle                                   \
      'Setting background color to "lightblue".' \
    --percent-box-label 'SCORES'                 \
    --extra-box-label 'EXTRA-BOX'                \
    --x-label ''  --y-label ''                   \
    --background-color lightblue                 \
    -- plot_layers_nodata.gff                    \
     > plot_layers_bgcol.ps
| |

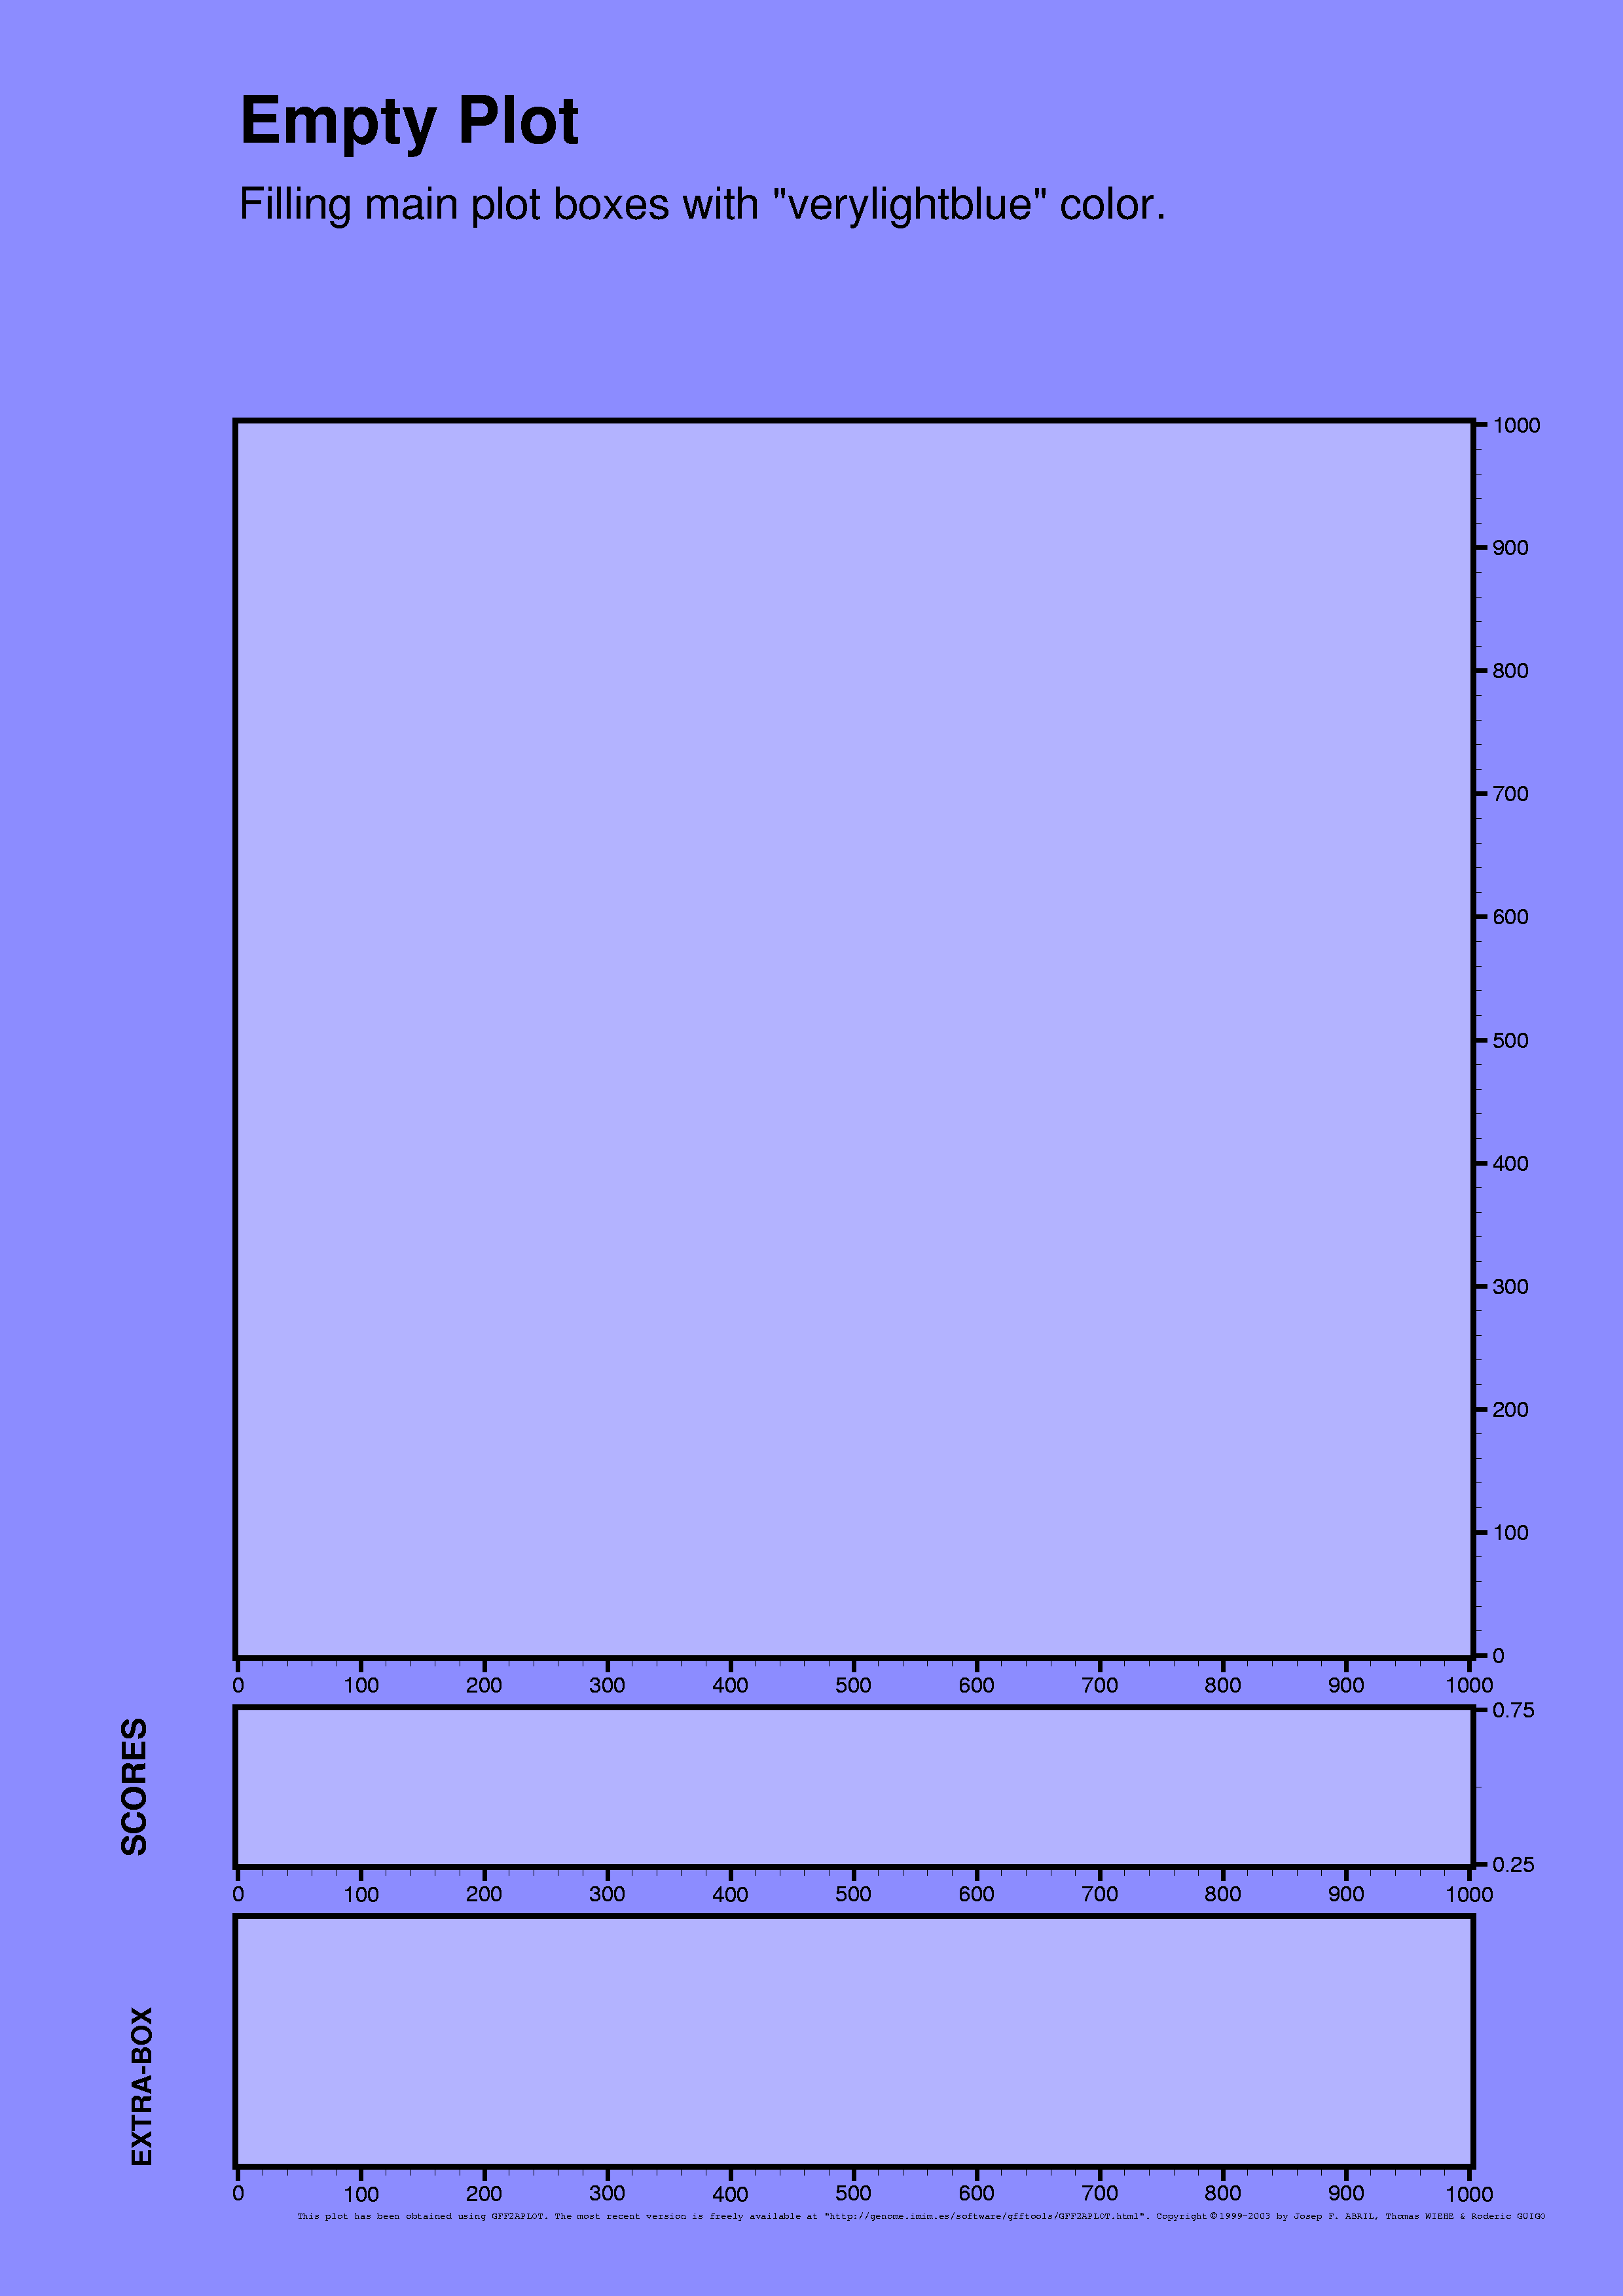
[PNG] [PS] [PDF]
| |
gff2aplot.pl                                                \
    --logs-filename plot_layers_boxcol.log                  \
    --show-percent-box                                      \
    --show-extra-box                                        \
    --x-sequence-coords 0..1000                             \
    --y-sequence-coords 0..1000                             \
    --title 'Empty Plot'                                    \
    --subtitle                                              \
      'Filling main plot boxes with "verylightblue" color.' \
    --percent-box-label 'SCORES'                            \
    --extra-box-label 'EXTRA-BOX'                           \
    --x-label ''  --y-label ''                              \
    --background-color  lightblue                           \
    --aplot-box-color   verylightblue                       \
    --percent-box-color verylightblue                       \
    --extra-box-color   verylightblue                       \
    -- plot_layers_nodata.gff                               \
     > plot_layers_boxcol.ps
| |
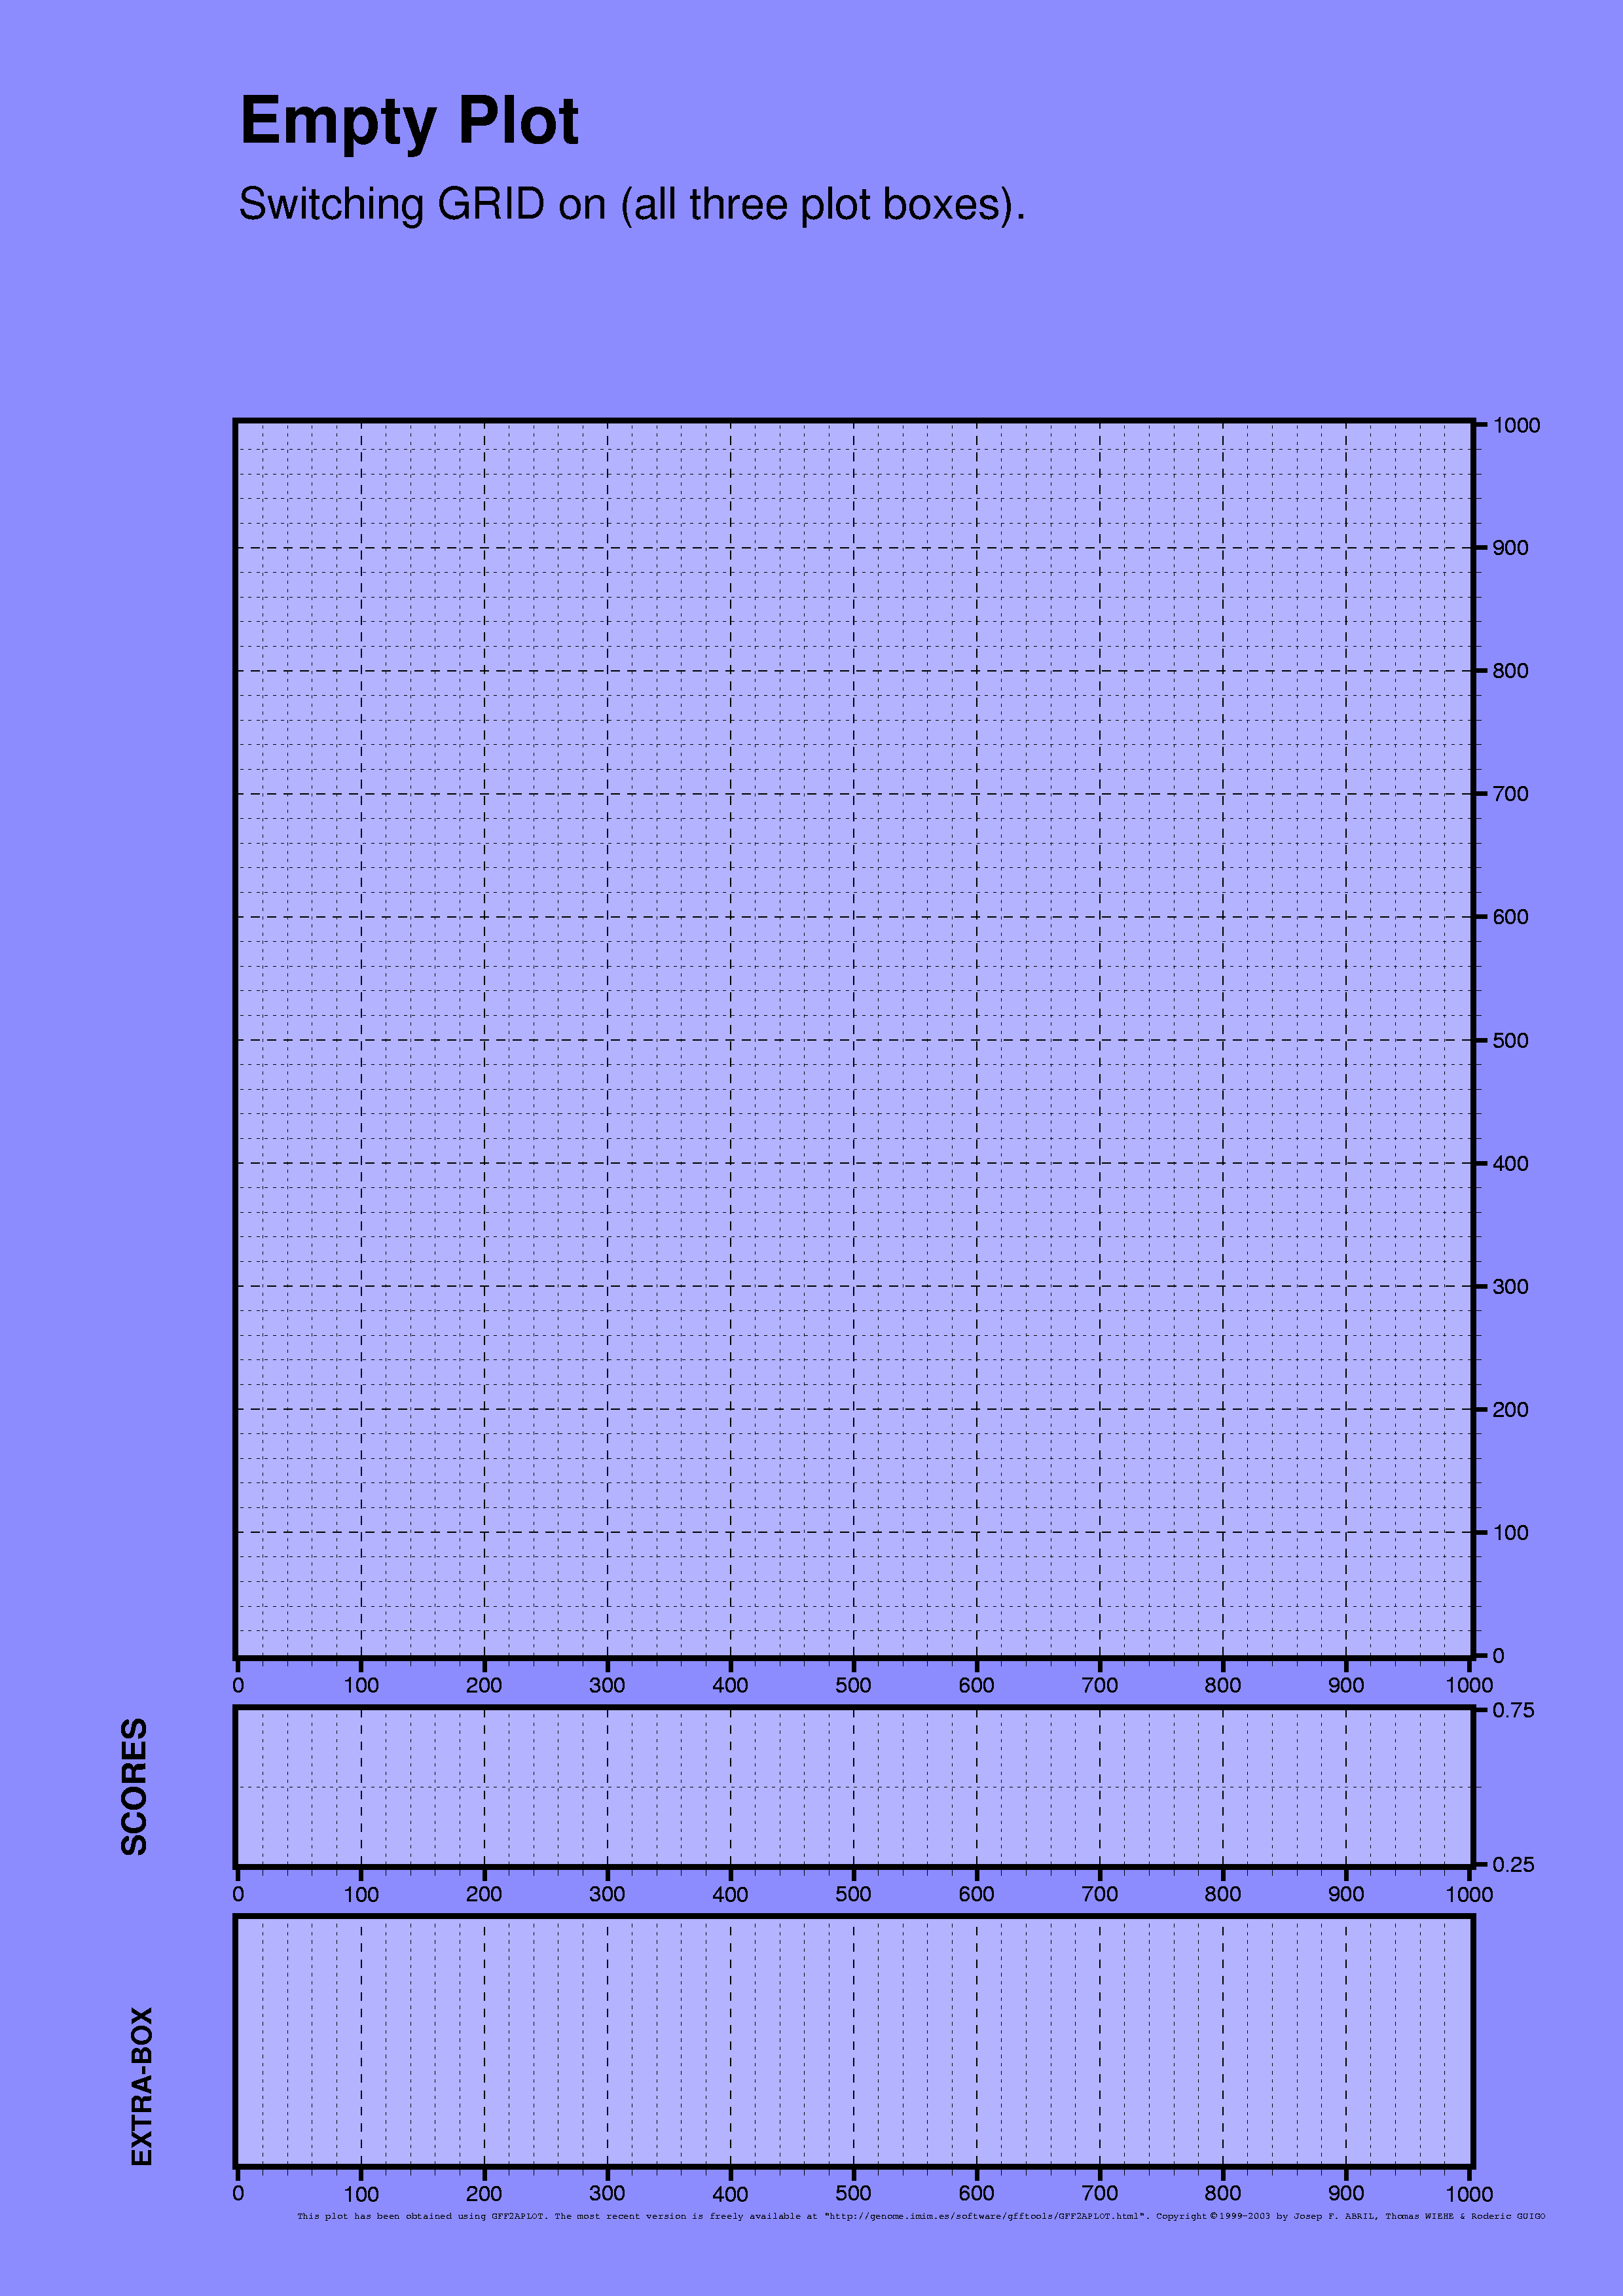
[PNG] [PS] [PDF]
| |
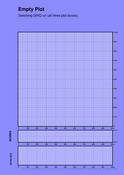
gff2aplot.pl                                      \
    --logs-filename plot_layers_grd.log           \
    --show-percent-box                            \
    --show-extra-box                              \
    --x-sequence-coords 0..1000                   \
    --y-sequence-coords 0..1000                   \
    --title 'Empty Plot'                          \
    --subtitle                                    \
      'Switching GRID on (all three plot boxes).' \
    --percent-box-label 'SCORES'                  \
    --extra-box-label 'EXTRA-BOX'                 \
    --x-label ''  --y-label ''                    \
    --background-color  lightblue                 \
    --aplot-box-color   verylightblue             \
    --percent-box-color verylightblue             \
    --extra-box-color   verylightblue             \
    --show-grid                                   \
    -- plot_layers_nodata.gff                     \
     > plot_layers_grd.ps
| |
|
Annotation Layer
|
|
|
Shapes Layer
|
|
|
Alignment Layer
|
|
|
Top Layer
|
|
|
|